446
Proceedings of the 18
th
International Conference on Soil Mechanics and Geotechnical Engineering, Paris 2013
Inorganic clays
The data from the following conditions were excluded.
Geologically overconsolidated clays
Rotating angles of tested specimens
Consolidation method: SHANSEP
Isotropically consolidated triaxial
Hollow Cylinder Apparatus test results
Unconfined compression or unconsolidated undrained
Organic clays and peat
Artificial, remolded or resedimented clays
2.3
Anisotropy database
A total of 203 pairs of CK
o
UC and CK
o
UE test results were
collected. The 53 resources reported by Mayne (1983) were also
carefully reviewed following the data selection criteria listed
above. The database covers 14 countries and data published
between 1972 and 2007. A relatively large amount of anisotropy
data (86) have been published for Japanese natural clays.
Statistical information of the database is summarized in Table 1.
Table 1. Statistical information of the database
Area
Country Local name
No.
data
Plasticity
Index
K
s
(S
uE
/ S
uC
)
Northern Finland Kimola
1
31
0.70
Europe Norway Various sites
19
4~32 0.23~0.78
Sweden Various sites
4
26~53 0.63~0.79
Europe Italy
Porto Tolle, Trieste
2
30~47 0.61~0.81
France
Various sites
3
54-67 0.49~0.64
UK
Bothkennar
9
28~43 0.36~0.58
North
Canada
NBR and other sites
21
5~57 0.41~0.74
America USA
Gulf of Mexico
2
33~55 0.78~0.79
Asia
Iraq
Khor Al-Zubair, Fao
10 18~36 0.50~0.89
Japan
Osaka bay
25 50~71 0.55~0.91
Izumo
21 25~104 0.69~1.06
Ariake
13 36~81 0.60~1.00
Kinkai
11 22~80 0.64~1.08
Tokyo bay
8
36~50 0.59~0.73
Various sites
8
35~75 0.48~0.64
Indonesia Banjarmasin, Surabaya 3
60~85 0.65~0.83
Singapore Singapore
3
34~58 0.88~1.08
Thailand Bangkok
12 26~77 0.74~1.27
Korea
Namak
20 22~41 0.45~0.65
Shihwa
8
14~25 0.66~0.89
14 countries
203 4~104 0.23~1.27
2.4
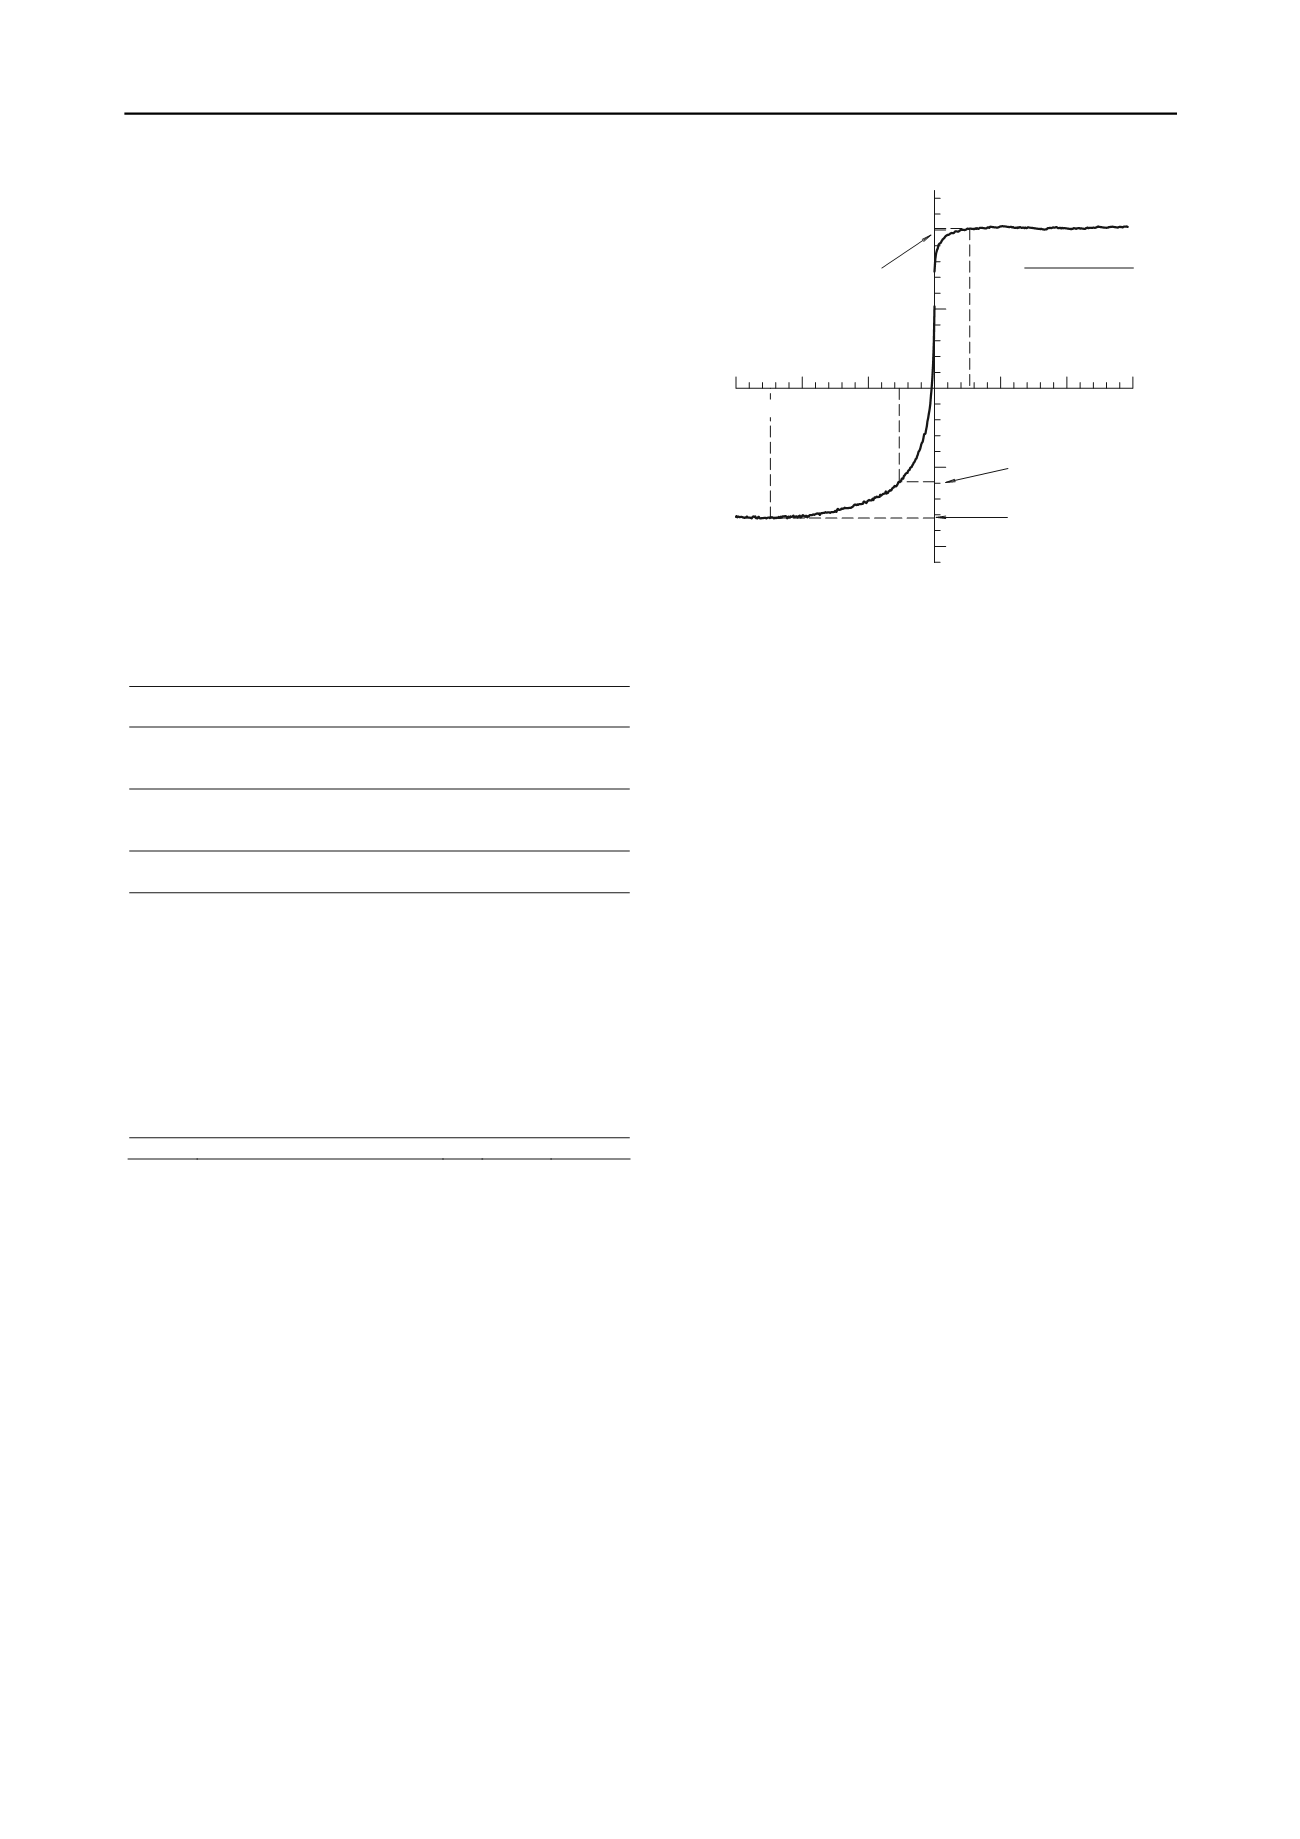
Definitions of failure in extension test
There are two common definitions of the failure for triaxial
extension test (Tanaka et al. 2001a).
Definition-A: strength at the same strain level (typically less
than 2 %) as the peak strength from a compression test
Definition-B: peak strength (necking failure) or strength at
15 % of axial strain if the peak is not observed
It is evident that undrained shear strength values from
CK
o
UE will be significantly different, depending on the
definitions of failure. An example of the different failure
definitions is shown in Figure 1: A specimen from 8.4m depth
has S
uC
/
’
vc
=0.202 and the corresponding extension specimen
has S
uE
/
’
vc
=-0.118 and -0.164 following the failure definition-
A and -B, respectively. The difference in anisotropic strength
ratio between the definition-A (K
s
=0.584) and B (K
s
=0.812) is
about 40 %. Irrespective of the failure modes (necking or
ductile) in extension tests, the difference between the two
failure definitions will be substantial. Many published data did
not have its definitions of failure for either triaxial compression
or extension tests.
S
u
/
'
vc
-0.1
-0.2
0.2
0.1
5
10
15
-15
-10
-5
Axial strain,
(%)
f
=2.7%
f
=-2.7%
Failure definition A
S
uE
/
'
vc
= -0.118
Failure definition B
S
uE
/
'
vc
= -0.164
Sample LL PI
SH-2 8.4m 36 17
f
=-12.4%
S
uC
/
'
vc
= 0.202
Figure 1. An example of the definitions of failure for CKoUE test.
2.5
Strain rate effects
It was found that many authors and institutes used different
strain rates for the undrained shearing. For example, strain rates
of the undrained (compression/extension) shearing were 0.75
%/hr for NGI in Norway, 6.0 %/hr for PHRI in Japan, 0.18 %/hr
for UK, 0.5 %/hr for USA. The two Korean marine clays were
sheared at 3.0 %/hr. Strain rate effects on anisotropy are not
covered in this study and are assumed to be insignificant.
3 DEPOSITIONAL ENVIRONMENTS
For further comparison, it is vital to review depositional and
post-depositional environments of the clays presented in this
study, with regard to their physical and geotechnical properties.
3.1
Scandinavian clays
Depositional environments and the following geological events
(leaching) in Scandinavian clays were well documented by
Bjerrum (1954) as the causes of quick clay formation. A typical
feature of glacially derived clays is that the clay fraction (< 2
m) contains considerable quantities of non-clay minerals (rock
flour). For example, the rock flour of the Drammen clay was
produced by the abrasive action of glacial ice during the Ice
Age (Tanaka et al. 2001a). As a result, the Drammen clay has a
high clay-size fraction (40-50%) but plasticity index is
approximately 20 (Tanaka and Tanaka 1997).
3.2
European and Gulf of Mexico (USA) clays
Unlike the well-documented Bothkennar clay in the United
Kingdom (Nash et al. 1992, Tanaka et al. 2003), depositional
environments of the other European clays are not readily
available. The Bothkennar clay is characterized as a Holocene
deposit with low clay fractions. Abundant thin laminations and
mottled features are commonly observed. Overconsolidation
ratios are about 2 without any stress changes after its deposition,
is most probably caused by ageing or cementation. The
Bothkennar clay was formed since 8,500-6,000 years B.P.
(before present) under an estuary environment. The Italian and
French clays in the database are geologically normally
consolidated deltaic clays. Information of the depositional
environments of the two data points from an offshore site, Gulf
of Mexico, USA is not available. However, the marine clay
deposits in the Gulf of Mexico are known as geologically
normally consolidated Pleistocene or Holocene clays, except for
the cases where excess pore pressure is present. Abundant
smectite, yet moderate sensitivity (2~4) are the known
characteristics.


