436
Proceedings of the 18
th
International Conference on Soil Mechanics and Geotechnical Engineering, Paris 2013
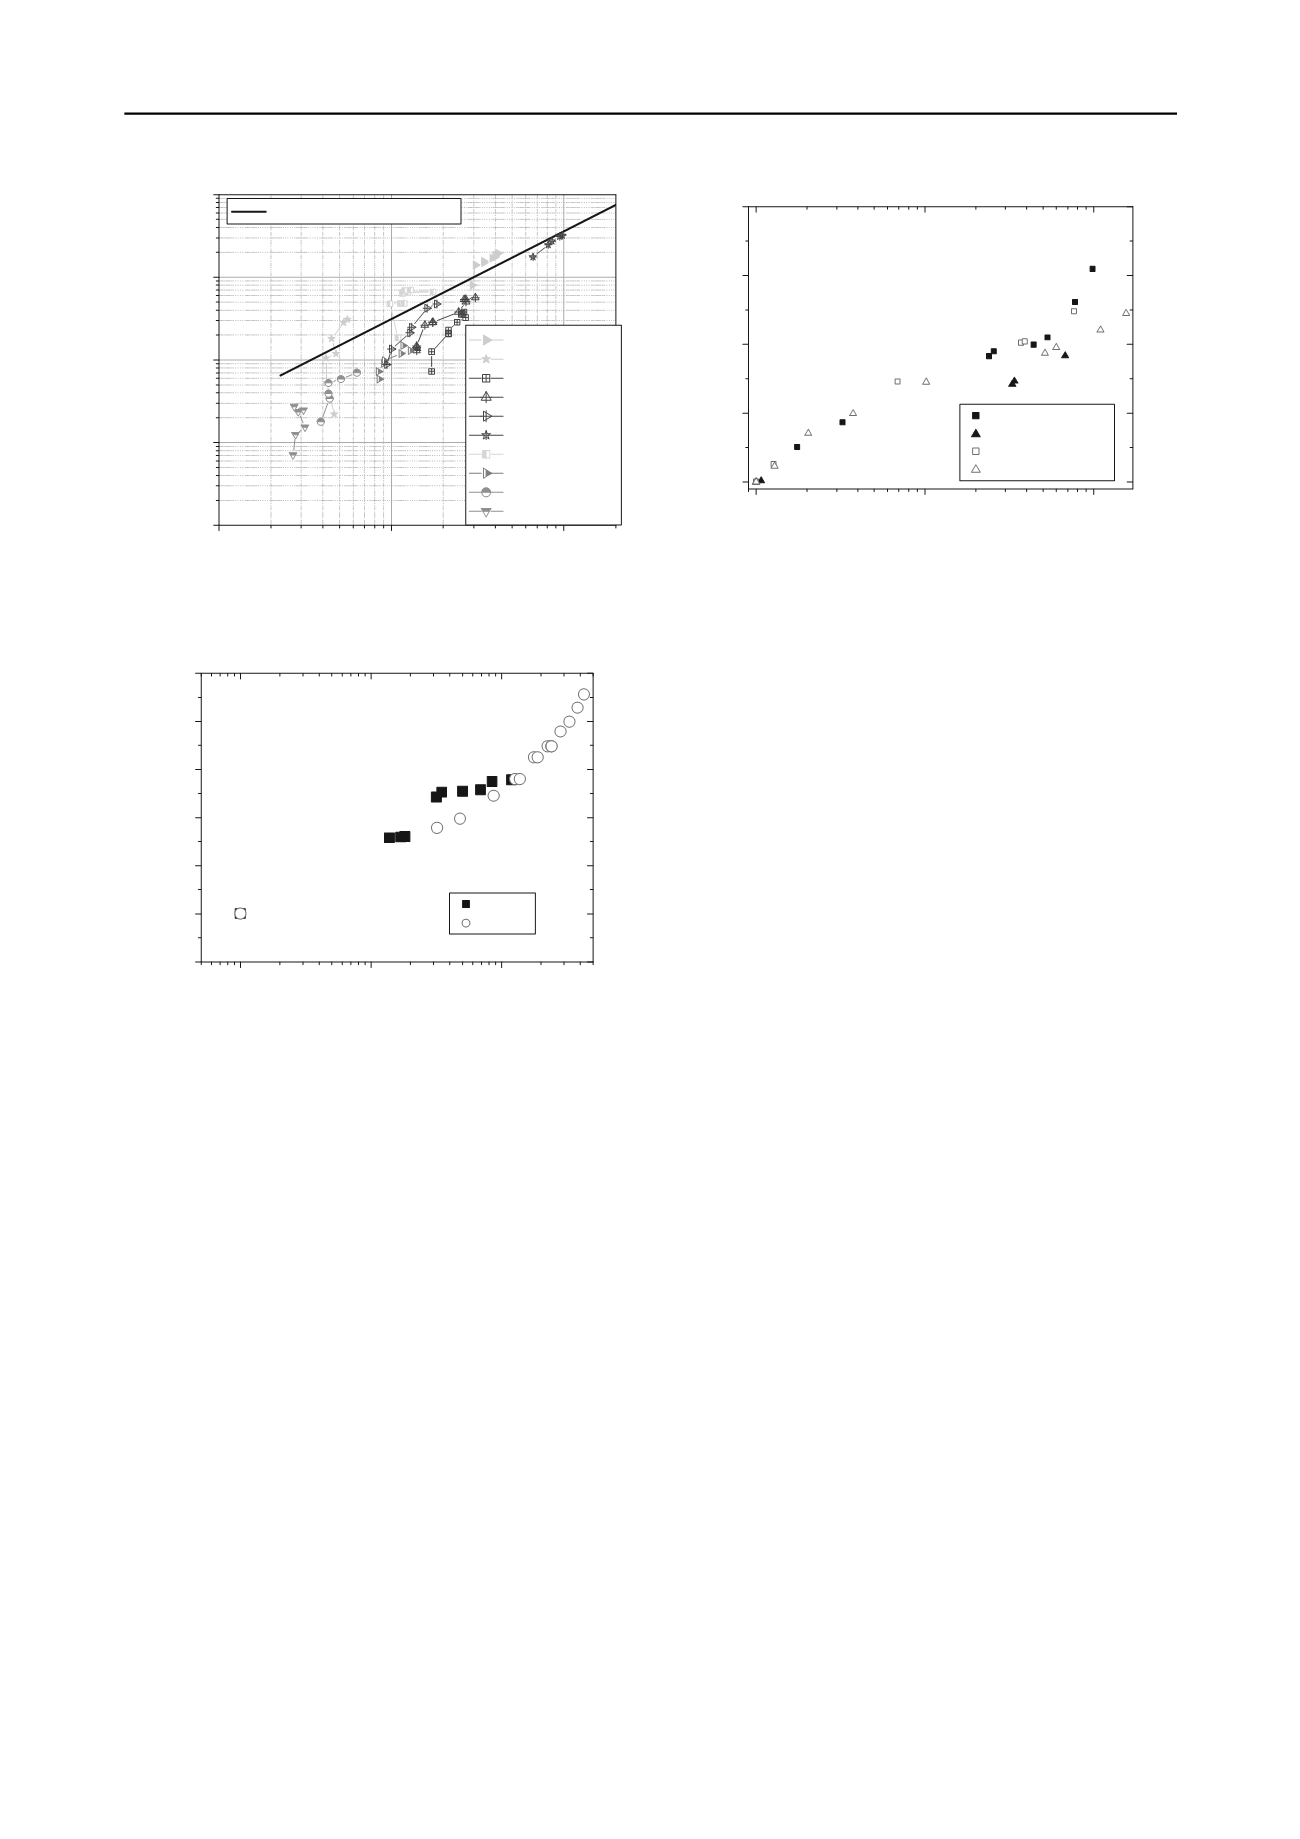
Figure 6. Relation between
G
and
s
u
. Numbers in the figure indicate
the elapsed time after remolding.
1
10
100
0
1
2
3
4
5
6
NSF c lay
T hixo t r opy
G / G
at1h
T ime (hour)
w
i
=54%
48%
Figure 7. Increase in
G
during thixotropy test.
5) The increment of the shear modulus under secondary
consolidation is shown relatively low, compared with that
developed during the thixotropic process. It is suggested that
these differences may caused by the different constraint
pressures between the secondary consolidation and thixotropic
condition, i.e., the free arrangement of soil particles is prevented
under the former condition, while under thixotropic condition,
the soil particles can be freely arranged.
From the present study, we can point out the importance of
thixotropic hardening phenomenon for understanding soil
behavior with high water contents. It is well known that the
void ratio or water content in situ is much larger than that
predicted by laboratory consolidation tests based on
e
-log
p
’
relation at the EOP (for example, Tanaka et al., 2004). If we
consider the secondary consolidation effect, in situ void ratio
should be smaller than that predicted from
e
-log
p
’
relation at
the EOP. To cope with such inconsistency, Burland (1990) has
proposed a concept of Sedimentation Consolidation Line (SCL),
considering the cementation or fabric effect. Study on the
thixotropy, which was conducted in the present study, is also
expected to provide an important key to understanding such a
phenomenon.
Figure 8. Increase in G during the secondary consolidaiton.
6 REFERENCES
Burland, J. B. 1990. On the compressibility and shear strength of natural
clays,
Géotechnique
40(3), 329-378.
Seng, S. and Tanaka, H. 2011. Properties of cement-treated soils during
the initial curing stages,
Soils and Foundations
51(5), 775-784.
Tanaka, H., Kang, M. S. and Watabe, Y. 2004. Ageing effects on
consolidation properties
–
Based on the site investigation of Osaka
Pleistocene clays-
,
Soils and Foundations
44(6), 39-51.
Wood, D. M. 1990.
Soil behavior and critical state soil mechanics
,
Press Syndicate of the University of Cambridge, USA.
Yamashita, S., Kawaguchi, T. Nakata, Y., Mikami, T., Fujiwara, T. and
Shibuya, S. 2009. Interpretation of international parallel test on the
measurement of
G
max
using bender element,
Soils and Foundations
49(4), 631-650.
0.1
1
10
1
10
100
1000
10000
168
120
24
96
10
0.5
144
96 24
18
4
0.5
120
72
24 10
0.5
227.5
168
48
24
5
20
2
288
120
72
24 11
CTS (Seng and Tanaka, 2011)
F1 (40.9%; 0.84)
F2 (52.5%; 1.08)
K1 (62.3%; 1.00)
K2 (60.6%; 0.97)
K4 (62.1%; 1.00)
K5 (46.0%; 0.74)
N1 (54.0%; 0.93)
H1 (241.3%; 0.98)
T1 (134.3%; 1.21)
T2 (149.3%; 1.35)
Shear Modulus,
G
(kPa)
Undrained Shear Strength,
s
u
(kPa)
20
0.5
1
10
100
1.0
1.1
1.2
1.3
1.4
NSF c lay
O edomet er T es t
G / G
EOP
t / t
EOP
w
i
=80%, p=8kPa
p=20kPa
w
i
=105%, p=8kPa
p=16kPa


