443
Technical Committee 101 - Session II /
Comité technique 101 - Session II
Proceedings of the 18
th
International Conference on Soil Mechanics and Geotechnical Engineering, Paris 2013
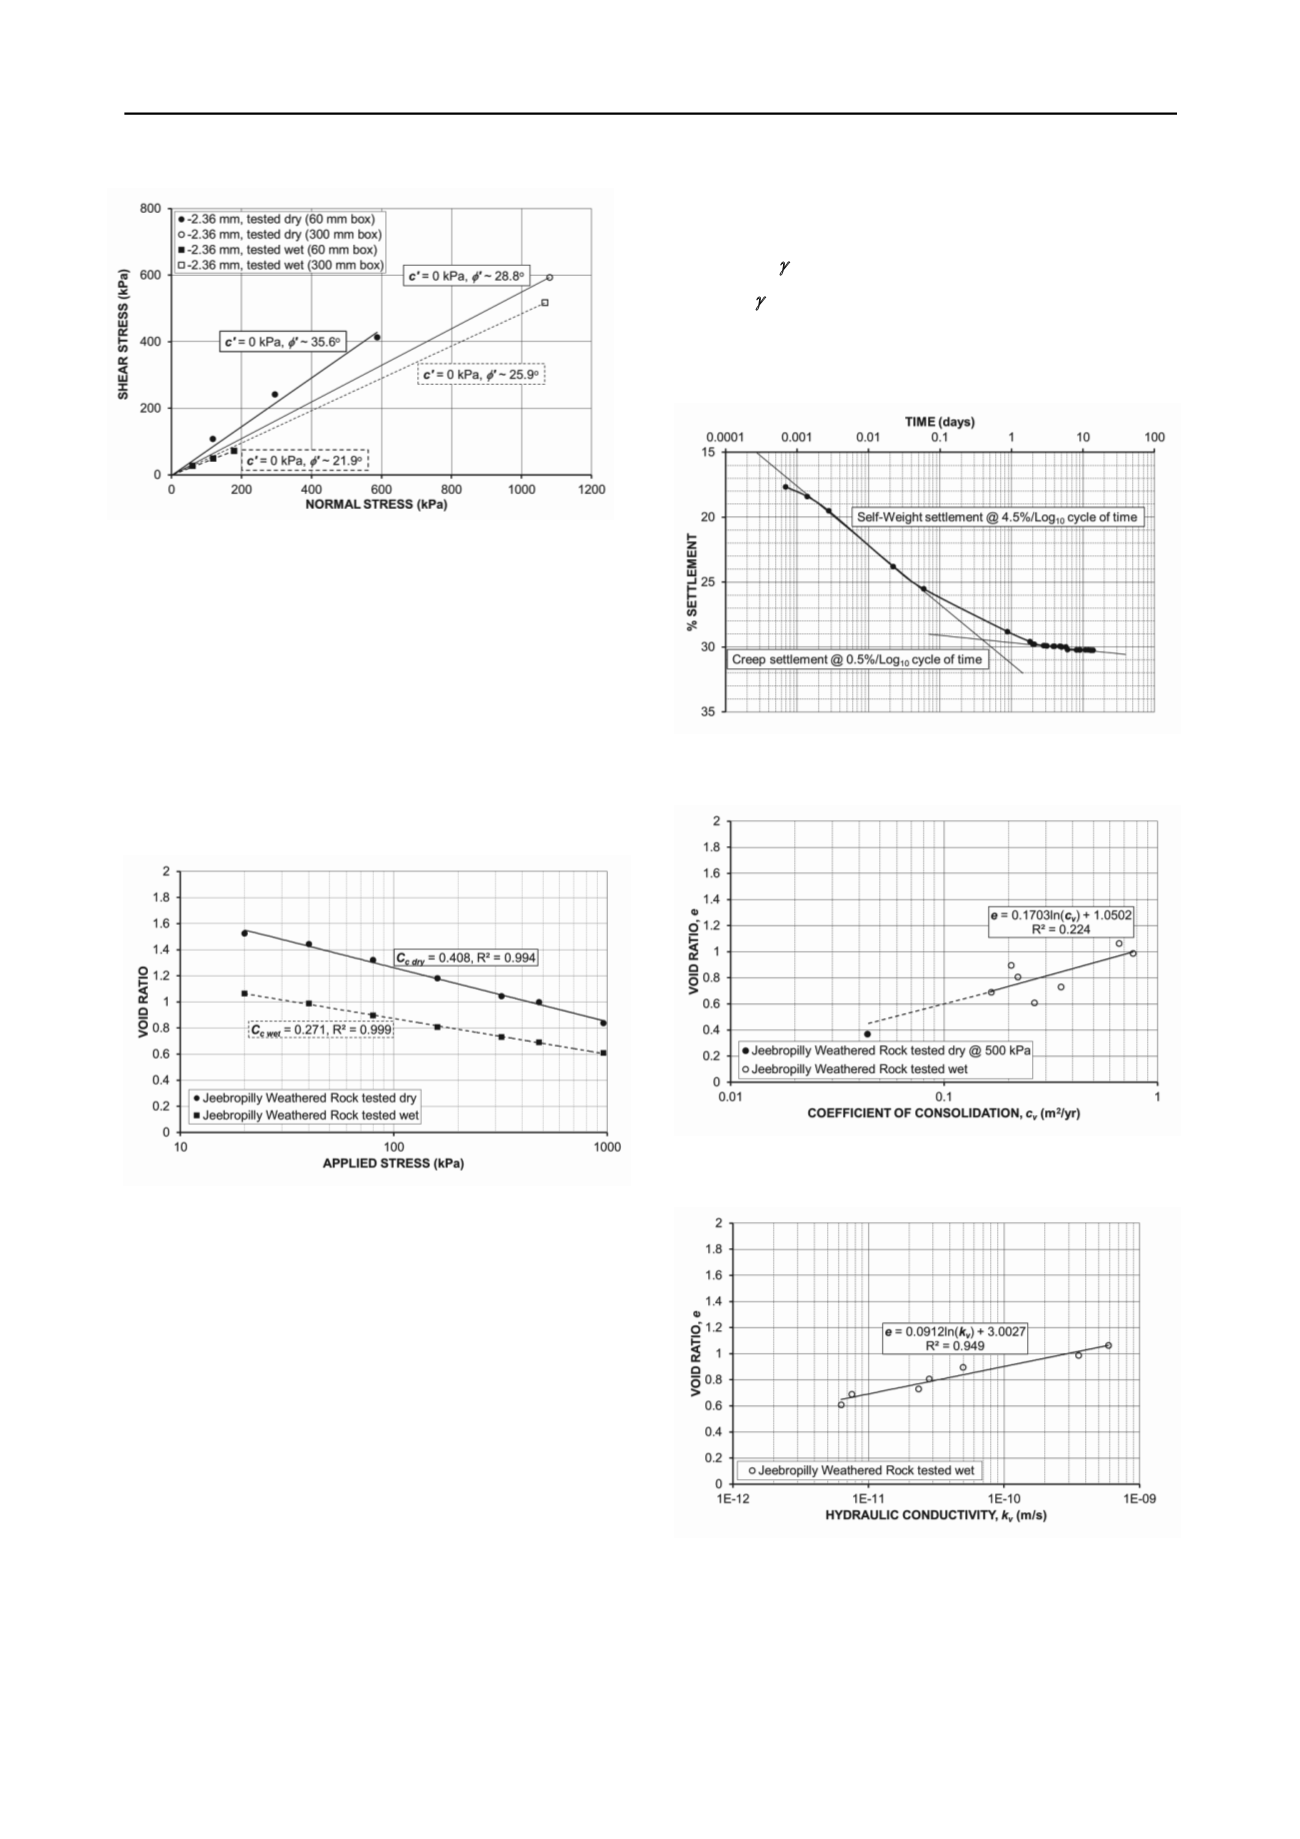
Figure 3. Comparison of friction only strength envelopes for 60 mm and
300 mm direct shear testing of -2.36 mm scalped Jeebropilly weathered
rock.
5 COMPRESSION UNDER LOADING
Staged, and single-stage creep, compression testing of loosely-
placed, -2.36 mm Jeebropilly weathered rock, at its as-sampled
gravimetric moisture content (that is, tested “dry”) or tested in a
water bath (that is, tested “wet”), was carried out in a 76 mm
diameter oedometer. The compression curves for the staged
testing under dry and wet conditions are shown in Figure 4,
indicating Compression Indices
C
c
of 0.408 and 0.271,
respectively.
Figure 4. Compression curves for staged testing of loose-placed, -
2.36 mm scalped Jeebropilly weathered rock under dry and wet
conditions.
The % settlement (relative to the initial loose height) versus
log
10
time plot for a loosely-placed specimen tested dry under a
single-stage creep loading of 500 kPa, over 14 days, shown in
Figure 5, indicates a self-weight settlement rate of 4.5%/log
10
cycle of time, and a creep settlement rate of 0.5%/log
10
cycle of
time.
From the staged testing under wet conditions and the creep
testing under dry conditions, coefficient of consolidation
c
v
values may be calculated as a function of void ratio
e
, as shown
in Figure 6. It is noteworthy that the data point from the single-
stage creep test carried out under dry conditions lines up with
the trendline for the data points from the staged testing under
wet conditions. The “dry” specimen, tested at its as-sampled
gravimetric moisture content of 14.8% (initial degree of
saturation of 24.7%), achieved a degree of saturation of 40.0%
by the end of the test. The relatively high final degree of
saturation for the dry test goes some way towards explaining
why the dry data point lines up with the wet trendline.
From the calculated coefficient of consolidation
c
v
and
coefficient of volume decrease
m
v
values, the saturated
hydraulic conductivity
k
v
values may be calculated from
Equation (1).
k
v
=
c
v
.
m
v
.
w
(1)
where
w
is the unit weight of water = 9.81 kN.m
3
. The
resulting
k
v
values are plotted in Figure 7, which demonstrate
the low permeability of wet -2.36 mm scalped Jeebropilly
weathered rock, even in a relatively loose state.
Figure 5. Single-stage creep loading of loose-placed, dry, -2.36 mm
scalped Jeebropilly weathered rock under 500 kPa for 14 days.
Figure 6. Coefficient of consolidation for loose-placed, -2.36 mm
scalped Jeebropilly weathered rock under wet and dry conditions.
Figure 7. Hydraulic conductivity for loose-placed, -2.36 mm scalped
Jeebropilly weathered rock under wet conditions.
6 DEGRADATION ON EXPOSURE
Jeebropilly weathered rock scalped to -19 mm was loose-placed
to a nominal depth of 100 mm in a Perspex tray measuring


