382
Proceedings of the 18
th
International Conference on Soil Mechanics and Geotechnical Engineering, Paris 2013
Proceedings of the 18
th
International Conference on Soil Mechanics and Geotechnical Engineering, Paris 2013
Colour
Dark grey
Greenish
grey
Greenish
grey
Degree of saturation (%)
95 ± 2
98 ± 2
94 – 100
3. HARDENING SOIL MODEL
The PLAXIS finite element software became popular in
geotechnical analysis and design. Constitutive models used in
PLAXIS are in line from the linear and non-linear elastic
models until the hardening double surface plasticity models
(Schweiger, 2009). One of the most well-known hardening type
models is the Hardening Soil Model (HSM). The HSM was
introduced in the PLAXIS program as an extension of the
Mohr-Coulomb model to allow for the pre-consolidation
pressure to be taken into account. Indeed, the HSM has been
developed under the framework of the plasticity theory. The
hyperbolic formulation (Duncan & Chang, 1970) is used to
define the stress-strain relationship. The total strains are
calculated using a stress-dependent stiffness, which is different
for both loading and unloading/reloading. The hardening is
assumed to be isotropic, depending on the plastic shear and
volumetric strains. A non-associated flow rule is adopted when
related to frictional hardening and an associated flow rule is
assumed for the cap hardening. The following explanation
provides a brief summary of the hyperbolic stress-strain and
stiffness response of HSM.
The stress-strain relationship, due to the primary loading, is
assumed to be a hyperbolic curve in the HSM. The hyperbolic
function, as given by Duncan & Chang (1970), for the drained
triaxial test can be formulated as:
1
50
,
2
a
a
q q
E q q
for
q
<
f
q
(1)
where
1
is the axial strain, and
q
is the deviatoric stress. The
ultimate deviatoric stress (
q
f
) is defined as:
3
6sin
cot
3 sin
f
q
c
(2)
and the quantity (
q
a
) is the asymptotic value of the shear
strength, in which
q
a
= q
f
/R
f
. The
R
f
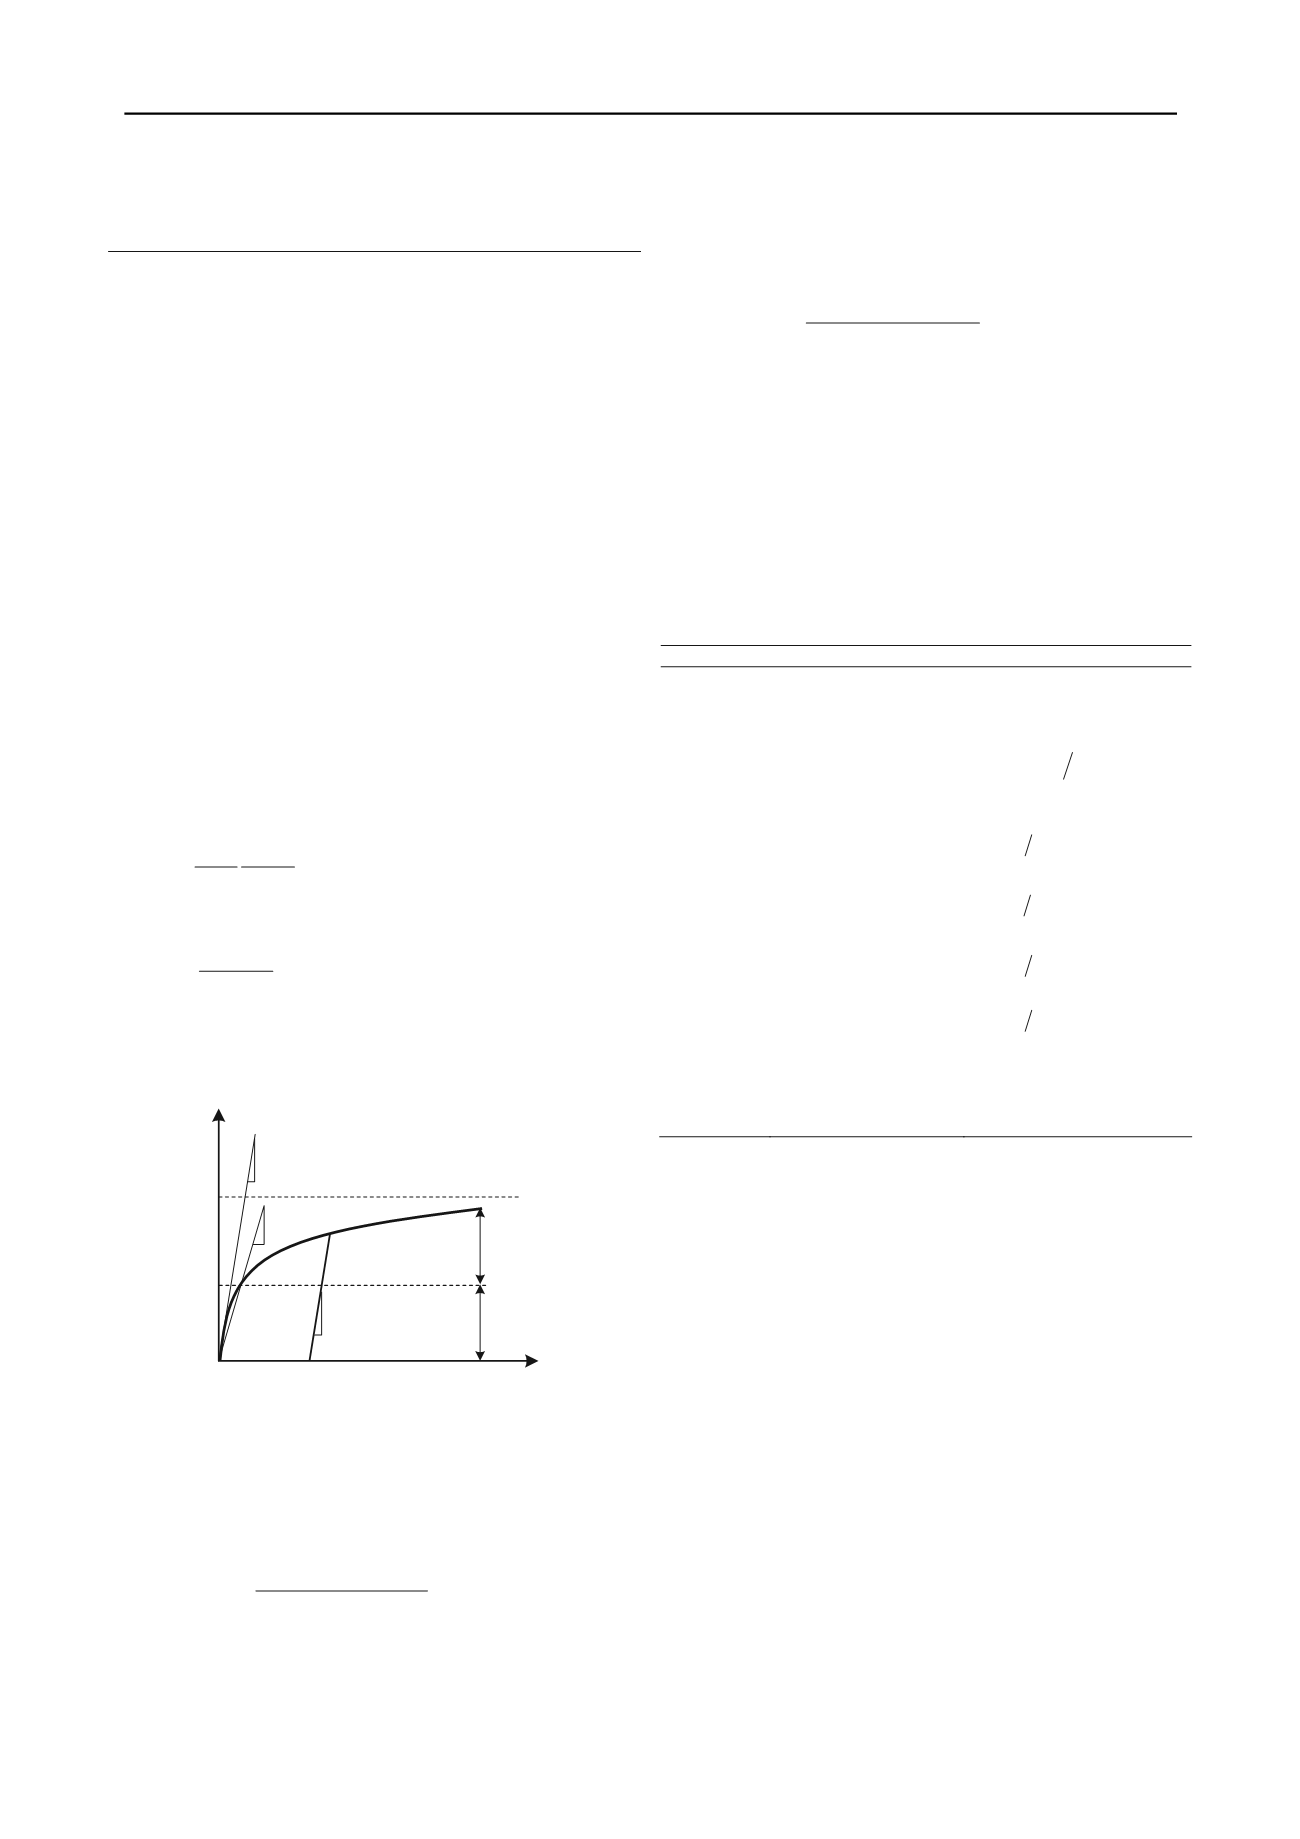
is the failure ratio. Figure 1
shows the hyperbolic relationship of stress and strain in primary
loading.
Figure 1. Hyperbolic stress-strain relationship in primary loading for a
standard drained triaxial test (Schanz
et al.
, 1999)
The stress strain behaviour for primary loading is highly non-
linear. The parameter
E
50
is a confining stress dependent
stiffness modulus for primary loading.
E
50
is used instead of the
initial modulus
E
0
for small strain which, as a tangent modulus,
is more difficult to determine experimentally, and is given as:
m
ref
ref
p
c
c E E
sin
cos
sin
cos
3
50
50
(3)
where is a reference stiffness modulus corresponding to the
reference stress
p
ref
(100 kN/m
2
). The actual stiffness depends
on the minor effective principal stress
, which is the effective
confining pressure in a triaxial test. The amount of stress
dependency is given by the power
m
.
ref
E
50
3
The stress dependent stiffness modulus for unloading an
reloading stress paths is calculated as:
m
ref
ref
ur
ur
p
c
c E E
sin
cos
sin
cos
3
(4)
where
is the reference modulus for unloading and
reloading, which corresponds to the reference pressure
p
ref
.
ref
ur
E
Another input parameter, the reference oedometer modulus
(
), is used to control the magnitude of the plastic
volumetric strains that originate from the yield cap. In a similar
manner to the triaxial moduli, the oedometer modulus (
E
oed
)
obeys the stress dependency law.
ref
oed
E
Schanz
et al.
(1999) explained in detail, the formulation and
verification of the HSM. A total of 10 input parameters are
required in the Hardening Soil Model, as tabulated in Table 2.
Table 2. Hardening Soil Model Input Parameters
3. EVALUATION OF STRENGTH AND STIFFNESS
PARAMETERS FOR BANGKOK CLAYS
All the test results analysed in this study were determined for
undisturbed samples taken at the appropriate depths for soft
clay, medium stiff clay and stiff clay. The 25.4 mm diameter
thin walled sample tubes were used for soft and medium stiff
clays are used for triaxial tests in weathered, soft and medium
stiff clays.
3.1
Triaxial Tests
The results of several series of compression and extension tests
carried out on weathered, soft and stiff clays are analysed. Test
specimens were approximately 72 mm in height and 36 mm in
diameter. Several series of isotropically consolidated drained
and undrained compression (CID, CIU) and extension (CIUE,
CIDE) tests carried out at the Asian Institute of Technology
were re-analysed in this study. Most of the CID, CIU, CIDE and
CIUE tests were carried out under strain controlled conditions
(Hassan 1976; Balasubramaniam & Uddin, 1977). In addition,
some load controlled CID and CIU tests were also considered
(Balasubramaniam & Chaudhry, 1978).
Parameter
Description
Parameter evaluation
'
Internal friction angle
Slope of failure line from
MC failure criterion
c'
Cohesion
y-intercept of failure line
from MC failure criterion
R
f
Failure ratio
1
3
1
3
f
ult
Dilatancy angle
Function of
a
and
v
ref
E
50
Reference secant
stiffness from drained
triaxial test
y-intercept in
log(
3
ref
p
)-log(
E
50
) space
ref
oed
E
Reference tangent
stiffness for oedometer
primary loading
y-intercept in
log(
1
ref
p
)-log(
E
oed
) space
ref
ur
E
Reference
unloading/reloading
stiffness
y-intercept in
log(
3
ref
p
)-log(
E
ur
) space
m
Exponential power
Slope of trend-line in
log(
3
ref
p
)-log(
E
50
) space
ur
Unloading/reloading
Poisson’s ratio
0.2
nc
o
K
Coefficient of earth
pressure at rest (NC
state)
1-sin
'


