378
Proceedings of the 18
th
International Conference on Soil Mechanics and Geotechnical Engineering, Paris 2013
Proceedings of the 18
th
International Conference on Soil Mechanics and Geotechnical Engineering, Paris 2013
OCR
K K
NC
,0
0
(3)
where K
0,NC
= K
0
for normally consolidated conditions, OCR =
overconsolidation ratio, and
= exponential parameter. Mayne
and Kulhawy (1982) and Mesri and Hayat (1993), for example,
proposed sin
for
.
Although the Jaky
’
s K
0
equation have been widely used and
modified to better reflect the actual stress state, uncertainties
still exist, which has not been fully clarified yet. Examples are
the effect of particle characteristics, which differ inherently for
different materials, and the correlation to the friction angle
that is not constant but varies state-dependently.
3
TESTING PROGRAM
3.1
Materials
A series of laboratory tests were conducted to investigate and
analyze the K
0
evolution of granular materials. Three different
granular materials were adopted, which include Jumumjin sand,
spherical glass beads (GB), and etched glass beads (EGB). The
use of different granular materials was aimed to investigate the
effect of inherent particle characteristics, such as particle shape,
surface roughness, and angularity, on K
0
in more
straightforward and systematic manner. Jumunjin sand particles
were sieved, and the particles ranging between 0.425 mm and
0.85 mm (e.g., sieves #40 and #20) were collected and used in
the test, to presumably minimize the effect of fines content and
to make test samples equivalent in size hence directly
comparable to glass beads. The grain size distribution of
Jumunjin sand is shown in Fig. 1, in comparison with glass
beads. Sand particles are uniformly distributed with the mean
particle size D
50
of around 0.56 mm.
The soda lime glass beads (CaO-MgO-Na
2
O-SiO
2
) with
spherical particle shape and smooth surface (D
50
~ 0.5 mm)
were selected as comparative materials. The surface roughness
was controlled by etching clean, smooth glass bead surfaces
with hydrogen chloride-based solution (HCl, pH=1
0.5). Glass
beads were submerged in the hydrogen solution for 15 seconds
and were thoroughly rinsed with deionized water followed by
oven-drying at 80
o
C. This process produced uniformly etched
glass beads with rough surfaces, while the same spherical shape
as clean glass bead particles was maintained. Three samples
were then subjected to the assessment of K
0
measurements.
The values of
c
were 37.1
, 26.7
, and 30.0
for Jumunjin
sand, glass beads, and etched glass beads, respectively. The
values of
p
varied, depending on the relative densities and
particle characteristics considered in the tests.
Fig. 1 Grain size distribution curves of test materials.
3.2
Determination of K
0
The various test devices have been proposed to measure K
0
that
satisfy the radial strain limit, smaller than 5
10
-5
(Okochi and
Tatsuoka, 1984). The radial expansion of either membrane or
thin-wall tube can be servo-controlled to maintain the zero
lateral strain condition whereas the complex stress path and
multiple measurement systems are involved. Alternatively, the
strain gauges are attached to the thin-wall tube and the
horizontal stress is directly related to the cell deformation
within acceptable strain regimes (Zhu et al. 1995; Kolymbas
and Bauer 1993).
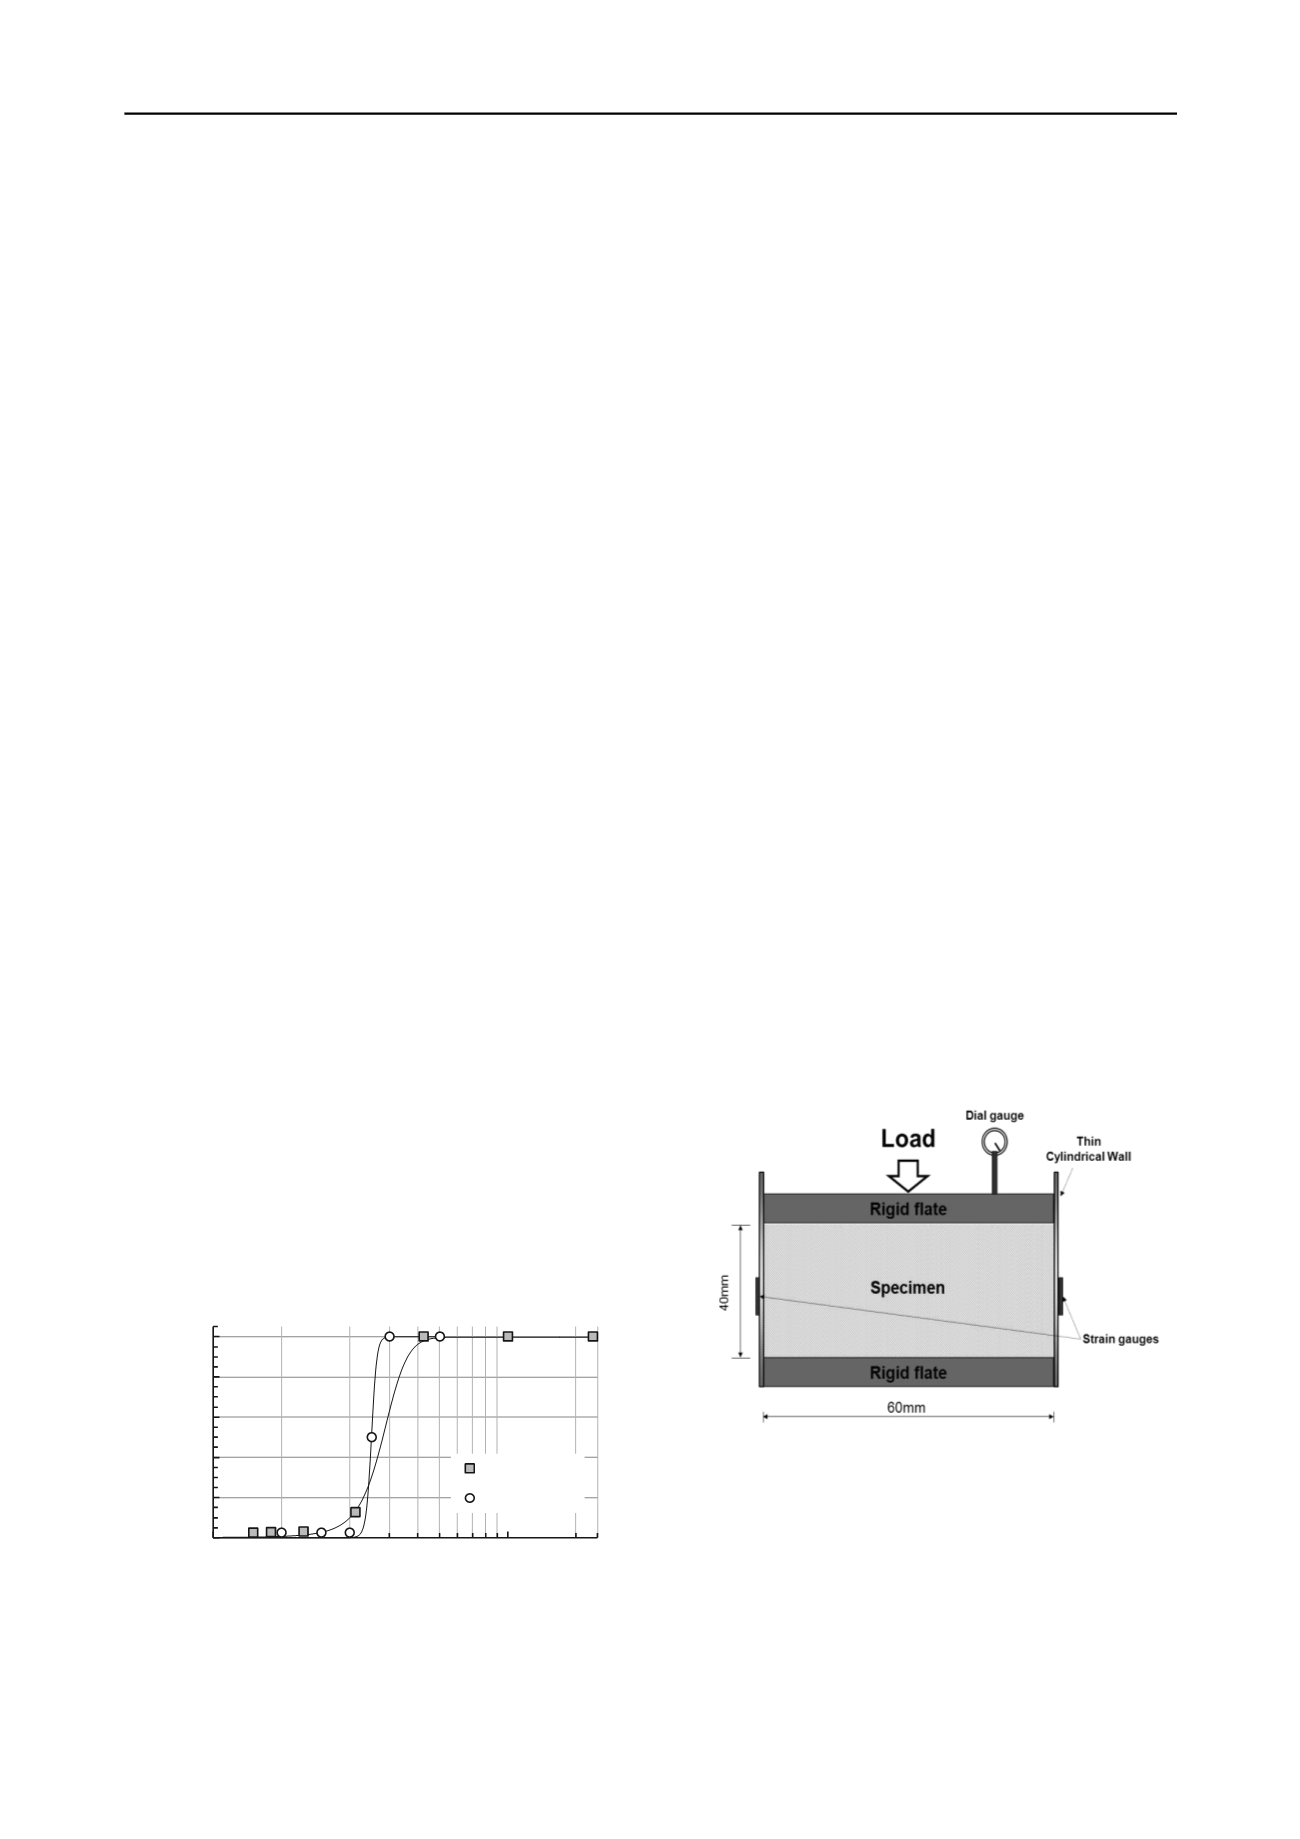
The oedometer method to measure K
0
adopted in this study
consists of a thin aluminum cylinder of 0.13 mm in thickness
and 66 mm in diameter. A pair of strain gauges (120ohm, CEA-
13-240UZ-120, Vishay) was attached at the middle height of the
cylinder outside and another pair of dummy gauges was
included for temperature compensation forming the full-bridge
circuit. The sample height is about 40 mm with a height to
diameter ratio equal to 0.61. Fig. 2 illustrates the experimental
configuration and peripheral electronics. The voltage response
of strain gauges was calibrated and correlated to the horizontal
stress using a water-filled balloon inside the cylinder, assuming
that the applied vertical stress is equal to the horizontal stress.
The linear calibration factor was then obtained and given as
follows:
8338 4
0476 0
.
V .
(4)
where
is the horizontal stress in the unit of kPa and V is the
voltage out in the unit of mV.
Dry samples were placed in the thin-wall oedometer to
achieve a target relative density and were subjected to loading-
unloading-reloading cycles. The maximum loading reached 111
kPa and reloading ran up to 143 kPa beyond the
preconsolidation stress. The voltage response was recorded
every 1 sec and each loading step lasted 5 to 10 minutes. The
horizontal stress for a given loading step was computed by
averaging voltage response and by applying the calibration
factor. The test specimens were prepared at different relative
densities of D
R
= 33% and 84% for Jumunjin sand and D
R
=
56% and 80% and D
R
= 55% and 81% for glass and etched
glass beads, respectively.
Fig. 2 Configuration of thin-wall K
0
test.
4
TEST RESULTS AND ANALYSIS
4.1
K
0
for Different Test materials
The changes of K
0
with
v
for the test materials measured from
the thin-wall oedometer are shown in Fig. 3 during the whole
loading cycles. As shown for the loose (LS) and dense (DS)
sands with D
R
= 33 and 84%, respectively, the K
0
values of the
dense sand run below the loose one at all the loading stages.
The dense sand provides the strong force chain along the
0
20
40
60
80
100
0,1
2
Percent finer [%]
Grain Size [mm]
sand
glass beads


