372
        
        
          Proceedings of the 18
        
        
          th
        
        
          International Conference on Soil Mechanics and Geotechnical Engineering, Paris 2013


            Proceedings of the 18


            th


            International Conference on Soil Mechanics and Geotechnical Engineering, Paris 2013


          Table 1. Soil parameters used in the numerical simulation
        
        
          .
        
        
          Elasto-plastic parameters
        
        
          Compression index


          ~
        
        
          0.100
        
        
          Swelling index


          ~
        
        
          0.011
        
        
          Critical state constant
        
        
          M
        
        
          1.46
        
        
          Intersect of NCL
        
        
          N
        
        
          (
        
        
          v
        
        
          at
        
        
          q
        
        
          =0,
        
        
          p
        
        
          ’=98.1kPa)
        
        
          1.570
        
        
          Poisson’s ratio
        
        
          v
        
        
          0.300
        
        
          Evolution parameters
        
        
          Degradation parameter of
        
        
          soil structure
        
        
          a
        
        
          (
        
        
          b
        
        
          =
        
        
          c
        
        
          =1.0)


            see


          Fig.5
        
        
          Degradation parameter of
        
        
          overconsolidated state
        
        
          m
        
        
          0.030
        
        
          Evolution parameter of


          b
        
        
          r
        
        
          1.00
        
        
          Limit of rotation
        
        
          m
        
        
          b
        
        
          0.001
        
        
          Initial conditions
        
        
          Initial specific ratio
        
        
          v
        
        
          0
        
        
          =1+
        
        
          e
        
        
          0
        
        
          1.637 (


            D


          =80%)
        
        
          1.536 (


            D


          =85%)
        
        
          1.457 (


            D


          =90%)
        
        
          Initial degree of structure 1/
        
        
          R
        
        
          0
        
        
          *


            see


          Fig.5
        
        
          Initial overconsolidation ratio 1/
        
        
          R
        
        
          0


            see


          Fig.5
        
        
          Initial anisotropy
        
        
          )
        
        
          (/
        
        
          0 0
        
        
          32


          0.01
        
        
          Initial mean effective stress
        
        
          p
        
        
          0
        
        
          ’
        
        
          9.80
        
        
          (kPa)
        
        
          an intercept of normal consolidation line


            N


          . Although soil
        
        
          structure degradation parameters


            a


          ,


            b


          and


            c


          are material
        
        
          coefficients,


            b


          =


            c


          =1.0 is adopted in this analysis for simplicity.
        
        
          The values for initial specific volumes


            v


          0
        
        
          are determined as the
        
        
          representative values from the specimens with a 10% initial
        
        
          water content. Compression index
        
        
          is obtained from the
        
        
          oedometer tests, while critical state constant


            M


          and swelling
        
        
          index are determined from the typical triaxial test results.


          ~


          ~
        
        
          In each simulation, the initial effective stress
        
        
          0
        
        
          is 9.8kPa
        
        
          and the isotropic consolidation is 100kPa; then the following
        
        
          undrained shearing is numerically performed.


            p


          In general, the simulation explains the triaxial test results
        
        
          well. Namely, basic parameters are used in common for all
        
        
          cases. Only the parameters for the soil structure are changed in
        
        
          order to reasonably explain the effects of the initial water
        
        
          content and the degree of compaction on the shear behavior.
        
        
          Therefore, the assumption that the initial water content of the
        
        
          specimen leads to generation of a high soil structure is
        
        
          considered to be valid.
        
        
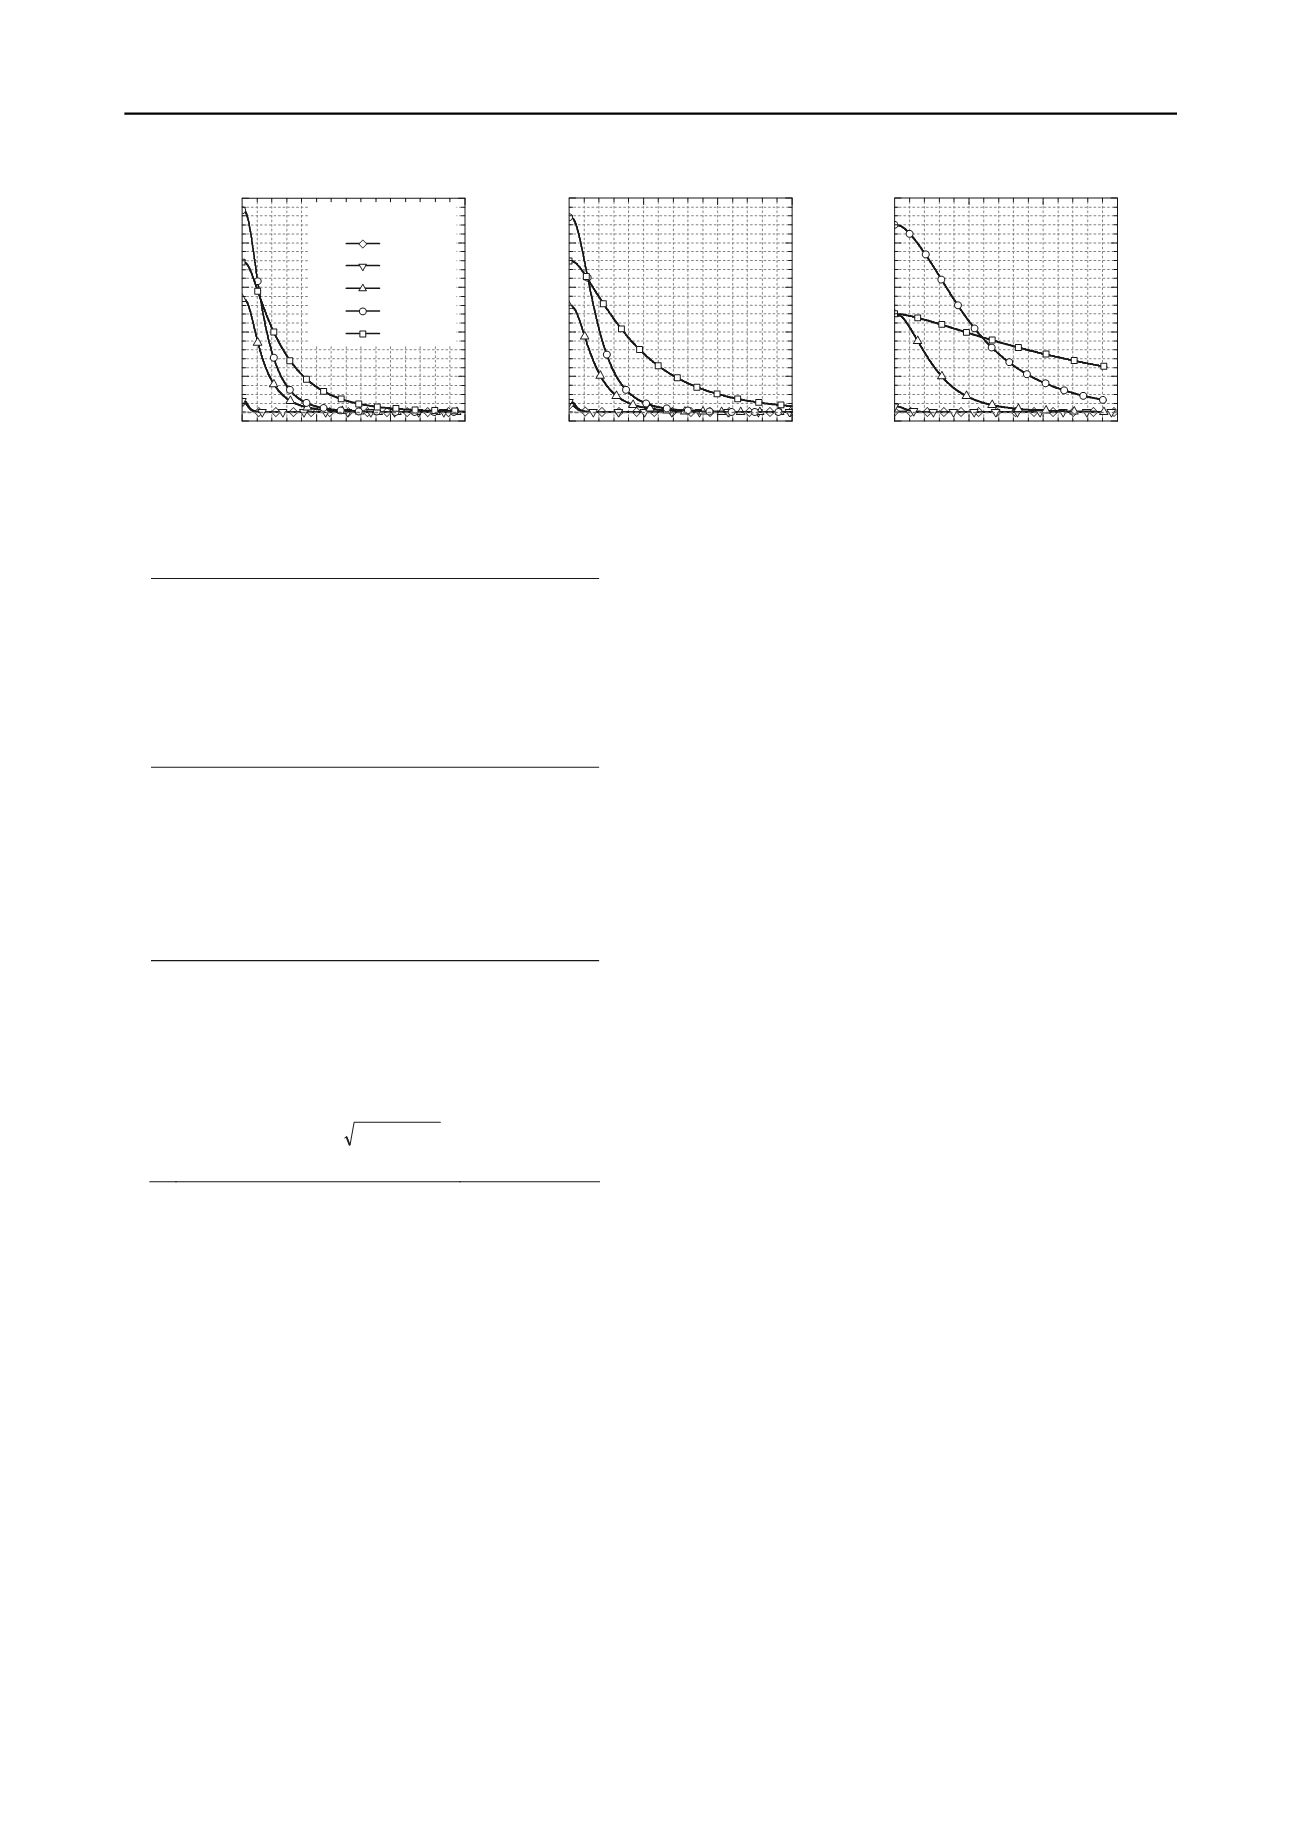
          Figure 5 illustrates the history of 1/


            R


          *
        
        
          , which describes
        
        
          how the soil structure deteriorates with an increasing the shear
        
        
          strain


          s
        
        
          .  In all the analytical cases, the degrees of soil structure
        
        
          1/


            R


          *
        
        
          gradually decrease and come closer to 1.0. Here, 1/


            R


          *
        
        
          =1.0
        
        
          means the disappearance of the soil structure. Since 1/


            R


          0
        
        
          *
        
        
          and


            a


          are assumed in this analysis, the 1/


            R


          *
        
        
          and


          s
        
        
          relations are kinds
        
        
          of installed functions, as shown in Figure 5. Using these
        
        
          relations dor the soil structure, the triaxial test results can be
        
        
          simulated well.
        
        
          0
        
        
          5
        
        
          10
        
        
          15
        
        
          0
        
        
          5
        
        
          10
        
        
          15
        
        
          20
        
        
          25
        
        
          Initial water content
        
        
          0%
        
        
          3%
        
        
          5%
        
        
          10%
        
        
          14%
        
        
          1/


            R


          *


            s


          (%)
        
        
          0
        
        
          5
        
        
          10
        
        
          15
        
        
          0
        
        
          5
        
        
          10
        
        
          15
        
        
          20
        
        
          25
        
        
          1/


            R


          *


            s


          (%)
        
        
          Figure 5. Degradation of degree of soil structure with increasing shear strain.
        
        
          (c)


            D


          = 90%
        
        
          (b)


            D


          = 85%
        
        
          (a)


            D


          = 80%
        
        
          5. SUMMARY
        
        
          When performing triaxial tests using specimens consisting of
        
        
          reconstructed gravel-mixed sand, the initial water content of the
        
        
          sample during the specimen preparation greatly influences the
        
        
          results of the tests. Various degrees of soil structures were
        
        
          generated with various values of sample suction in the specimen
        
        
          preparation. Although the specimens were fully saturated before
        
        
          the tests, the soil structure generated by the compaction under
        
        
          unsaturated conditions was probably maintained during the
        
        
          triaxial tests.
        
        
          The numerical simulation conducted in this study with the
        
        
          SYS Cam-clay model, which can describe the effects of the soil
        
        
          structure on the mechanical characteristics of soils, has verified
        
        
          the reason for the difference in the shear behavior of the gravel-
        
        
          mixed sand due to the difference in the initial water contents.
        
        
          By increasing the initial water content until the optimum water
        
        
          content is reached, a higher  soil structure seems to be generated
        
        
          in the specimen. On the other hand, the specimen reconstituted
        
        
          by the lower initial water content sample has a lower soil
        
        
          structure and easily loses it. By incorporating the above-
        
        
          mentioned concept, the complicated test results for the relation
        
        
          between the soil structure and the initial water content can be
        
        
          explained well.
        
        
          In practice, when the triaxial tests are performed using
        
        
          reconstituted sand specimens, a dry deposition method is
        
        
          usually adopted for the specimen preparation for convenience.
        
        
          However, it is difficult to generate the soil structure in the
        
        
          specimen with dry sand. Therefore, the triaxial test results using
        
        
          reconstituted specimens, made by the dry deposition method,
        
        
          may not express the real behavior of earth structures.
        
        
          6 ACKNOWLEDGEMENTS
        
        
          The authors would like to express their sincere thanks to Dr.
        
        
          Noda, a professor at Nagoya University, for his useful advice on
        
        
          the numerical simulation performed in this study.
        
        
          7 REFERENCES
        
        
          Ishihara K. 1993. Liquefaction and Flow Failure during Earthquakes,


            Géotechnique


          , 43 (3), 351-451.
        
        
          Asaoka A., Noda T., Yamada E., Kaneda K. and Nakano M. 2002  An
        
        
          elasto-plastic description of two distinct volume change
        
        
          mechanisms of soils,


            Soils and Foundations


          , 42 (5), 47-57