314
Proceedings of the 18
th
International Conference on Soil Mechanics and Geotechnical Engineering, Paris 2013
Proceedings of the 18
th
International Conference on Soil Mechanics and Geotechnical Engineering, Paris 2013
The preparation of the samples considered the following
steps: 1) drying the complete sample; 2) sieving the entire
sample; 3) separation of the fines (<0.074 mm) and coarse
(>0.074 mm) fractions; 4) preparation of the sample with the
fines content predefined by project. The probes were
compacted in layers to an initial density representative of the
expected in-situ compaction, with the tamping method and with
moisture close to optimum (± 2%, according to Standard
Proctor).
3 UNDRAINED SHEAR STRENGTH (S
U
)
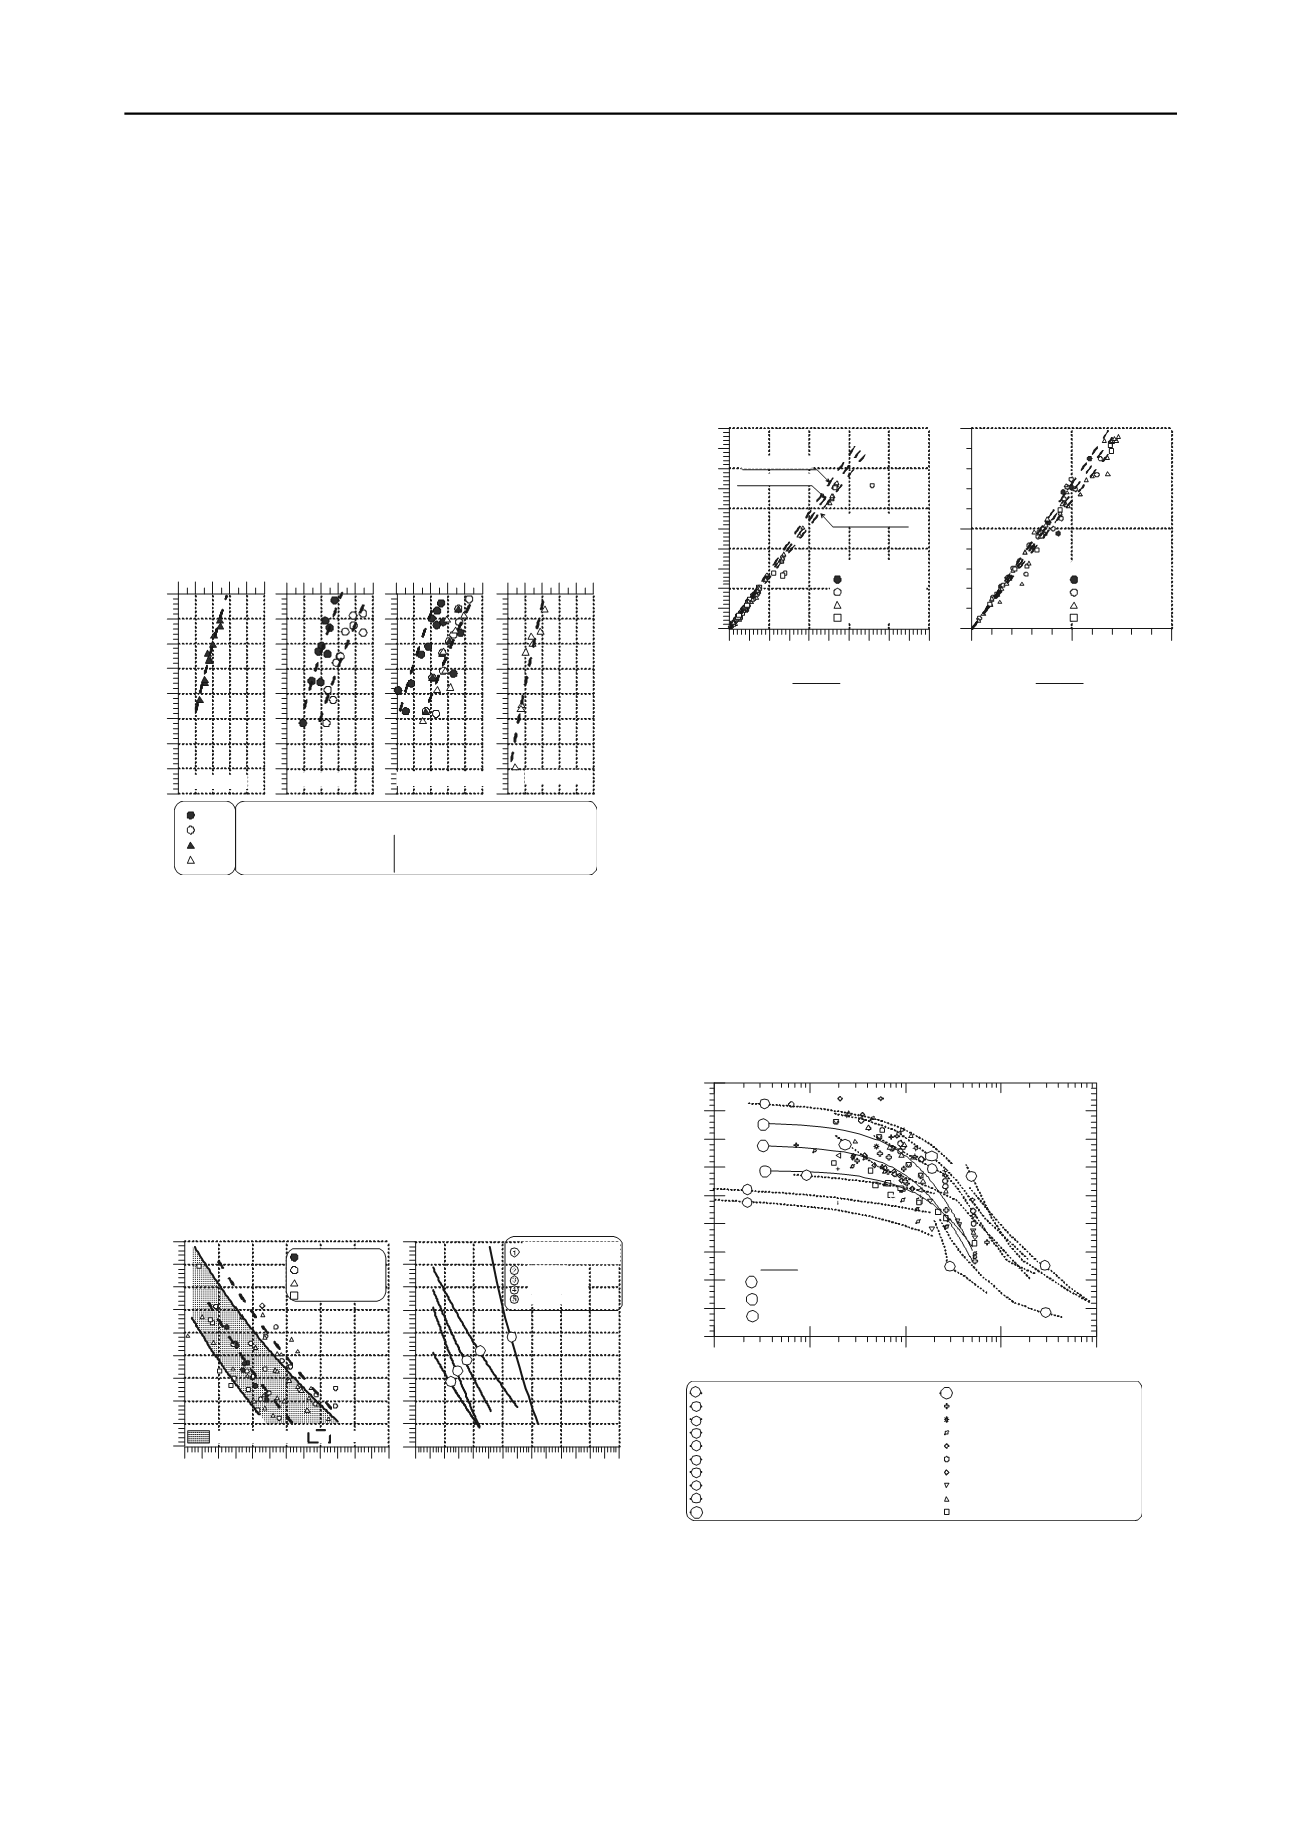
Figure 1 presents the variation of Su for the different sands as a
function of the void ratio (e) and the fines content. It is
important to note that the void ratio (e) indicated correspond at
the end of consolidation phase.
0.5 0.7 0.9
Void ratio (e)
1.6
1.4
1.2
1
0.8
0.6
0.4
0.2
0
Su (MPa)
12% Fines
0.5 0.7 0.9
Void ratio (e)
15% Fines
0.5 0.7 0.9
Void ratio (e)
S1
S2
S3
S4
18 to 21% Fines
0.5 0.7 0.9
Void ratio (e)
30% Fines
Best Fix Curve: Su=-C. ln(e)-D
12% Fines: C=3.50 D=0.85
15% Fines: C=2.94 D=0.59
C=2.94 D=0.074
18% to 21% Fines: C=2.62 D=0.78
C=2.62 D=0.112
30% Fines: C=4.18 D=1.40
Figure 1. Summary of undrained shear strength (Su) variation.
Figure 2a presents the variation of Su as a function of the void
ratio and Figure 2b presents the average tendency curves for all
samples tested. A tendency of Su to decrease as the fines
content increases was observed. In addition, and as reference, in
these figure 2b results obtained from the Toyoura Sand
(fines=0%), tested by Verdugo (1992) in a wide range of
relative density (DR=7% to 67%) have been included.
The variation of the undrained shear strength with the fines
contents estimate a value of zero for Su for average values of
e=0.72 (30% and 18-21% of fines), e=0.89 (15% of fines) and
e=0.78 (12% of fines). For the different sands tested, these void
ratios are associated to relative densities lower than DR<40%.
In the Toyoura Sand, Verdugo (1992) recorded zero values of
Su for values of DR<15%.
0.5 0.6 0.7 0.8 0.9 1 1.1
Void ratio (e)
-0.2
0
0.2
0.4
0.6
0.8
1
1.2
1.4
1.6
Su (MPa)
Sands12%Fines
Sands15%Fines
Sands18-21%Fines
Sands30%Fines
0.5 0.6 0.7 0.8 0.9 1 1.1 1.2
Void ratio (e)
ToyouraSand,0%Fines
Verdugo (1992)
2
3
4
5
12%Fines
15%Fines
18 to21%Fines
30%Fines
18% to 21% Fines
15% Fines
1
Figure 2. Variation of undrained shear strength (Su) with the void ratio
(e) and the fines content. Sand samples S1 to S4. (Campaña, 2011)
4 DRAINED SHEAR STRENGTH
The shear strength envelopes in the (q-p’) plane for CID triaxial
tests are presented in summary form on Figure 3. Values of
residual strength obtained in the CIU tests (Su) were also
included. In spite of the wide range of fines content in the four
samples tested, the shear strength envelopes obtained are
similar. For
’
3
<1 MPa, it are characterized by internal friction
angles (
) between
=32° and
=36°; for
’
3
>1 MPa, the
internal friction angles vary between
=32° to
=34°. No strong
reduction in the strength envelope at high pressures was
observed, this behavior is in contrast with the one observed with
the Sacramento Sand reported by Lee & Seed (1967). The little
quantity of particles crushing that is produced in the tailings
sands with the increase of confinement could be explained this
unexpected behaviour. This evidence was observed
systematically in the grain size tests performed before and after
each triaxial test (Campaña et al., 2007).
0 2 4 6 8 10
p'=
�
'
1
+2
�
'
3
3 (MPa)
0
2
4
6
8
10
q=
�
'
1
-
�
'
3
(MPa)
CIU and CID Test
Sands12%Fines
Sands15%Fines
Sands18-21%Fines
Sands30%Fines
0
1
2
p'=
�
'
1
+2
�
'
3
3 (MPa)
0
1
2
CIU and CID Test
Sands12%Fines
Sands15%Fines
Sands18-21%Fines
Sands30%Fines
a)
b)
M=1.45 (
�
=36°)
M=1.36 (
�
=34°)
M=1.36 (
�
=32°)
Figure 3. Drained and undrained residual strength curves.
a) all the tests, b) detail for
’
3
<2 MPa.
5 CRITICAL STATE OR PERFECT PLASTICITY
Although the ultimate state (steady state) has not clearly
reach in all the tests, by plotting the final results in the graph (e-
log p’), it can be observed that the results allow to mark off with
a reasonable precision the combination of density and
confinement pressure that determine that the sands present a
contracting or dilating behavior. By comparing the results of
this study with the ones reported in the technical literature, the
obtained behavior of tailing sands is in accordance with other
natural sands of similar mineralogy. These results allow to
extrapolate the behavior of tailings sands at higher confining
pressures and estimate that these would not present an important
decrease in the shear strength. Figure 4 presents all the tests,
compared with several results of other sands.
0.01
0.1
1
10
100
p'=(
�
'
1
+2
�
'
3
)/3 (MPa)
0.1
0.2
0.3
0.4
0.5
0.6
0.7
0.8
0.9
1
Void Index,e
Toyoura Sand (Ishihara 1993)
Loose Toyoura Sand (Mioura & Yamanouchi, 1975)
Dense Toyoura Sand (Mioura & Yamanouchi, 1975)
Hostun Sand (Le Long ,1968 after Biarez & Bard, 1992)
Ottawa Sand, 15% F (Murthy et al 2007)
Ottawa Sand, 10% F (Murthy et al 2007)
Ottawa Sand, 5% F (Murthy et al 2007)
Drained Cambria Sand (Yamamuro & Lade, 1996)
Undrained Cambria Sand (Yamamuro & Lade, 1996)
Dense Sacramento Sand (Lee & Seed, 1967)
Loose Sacramento Sand (Lee & Seed, 1967
S1 15%F
S1 18%F
S1 21%F
S2 15%F
S2 21%F
S3 12%F
S3 18% F
S4 20% F
S4 30% F
1
2
4
5
6
10
1
8
9
7
3
11
2
3
4
5
6
7
8
9
10
11
12
12
Best Fit
Sand S1, 15% Fines
13
13
Sand S3, 18% Fines
14
14
Sand S4, 30% Fines
Figure 4: Results of triaxial tests in the e-log p’ plane.
6 DEFORMATION MODULI, E
I
(
~10
-3
)
To determine the variation of the initial tangent deformation
moduli (Ei) at large deformations with the confining pressure, a
hyperbolic adjustment (Duncan et. al, 1970) was performed,
which was applied both for drained as well as for undrained
triaxial tests. The variation of the deformation modulus (E
i
) as


