319
Technical Committee 101 - Session II /
Comité technique 101 - Session II
40 (425 µm) sieve. At this point, the samples were at a water
content much greater than the liquid limit and were therefore
air-dried to reduce the water content. The soil was considered to
be at the desired water content when 23 to 25 blows using a
Casagrande liquid limit cup were required to close the groove
cut in the soil as specified in ASTM D4318-10.
Table 1. Soil index properties.
Soil
Specific
Gravity
LL
PL
PI
Clay-sized
Fraction
Colorado Clay
2.78
42
22
20
23.7
NOVA Clay
2.80
66
28
38
16.8
VBC
2.79
78
26
52
68.9
To perform CD direct shear tests, the test specimens were
formed directly in the direct shear box using a spatula or
“piped” from a pastry bag. Care was taken to form the test
specimens without entrapping air-bubbles. Prior to shearing, the
samples were consolidated under K
o
conditions to vertical
pressures ranging from 24 kPa to 288 kPa. The samples were
then sheared slow enough to allow full dissipation of the pore
pressures generated during shear using the criterion presented in
ASTM D3080-11.
Triaxial test specimens were more difficult to form for tests
at low effective consolidation stresses. At a water content equal
to the liquid limit, the soil does not have the shear strength
required to be formed into triaxial test specimens that can be
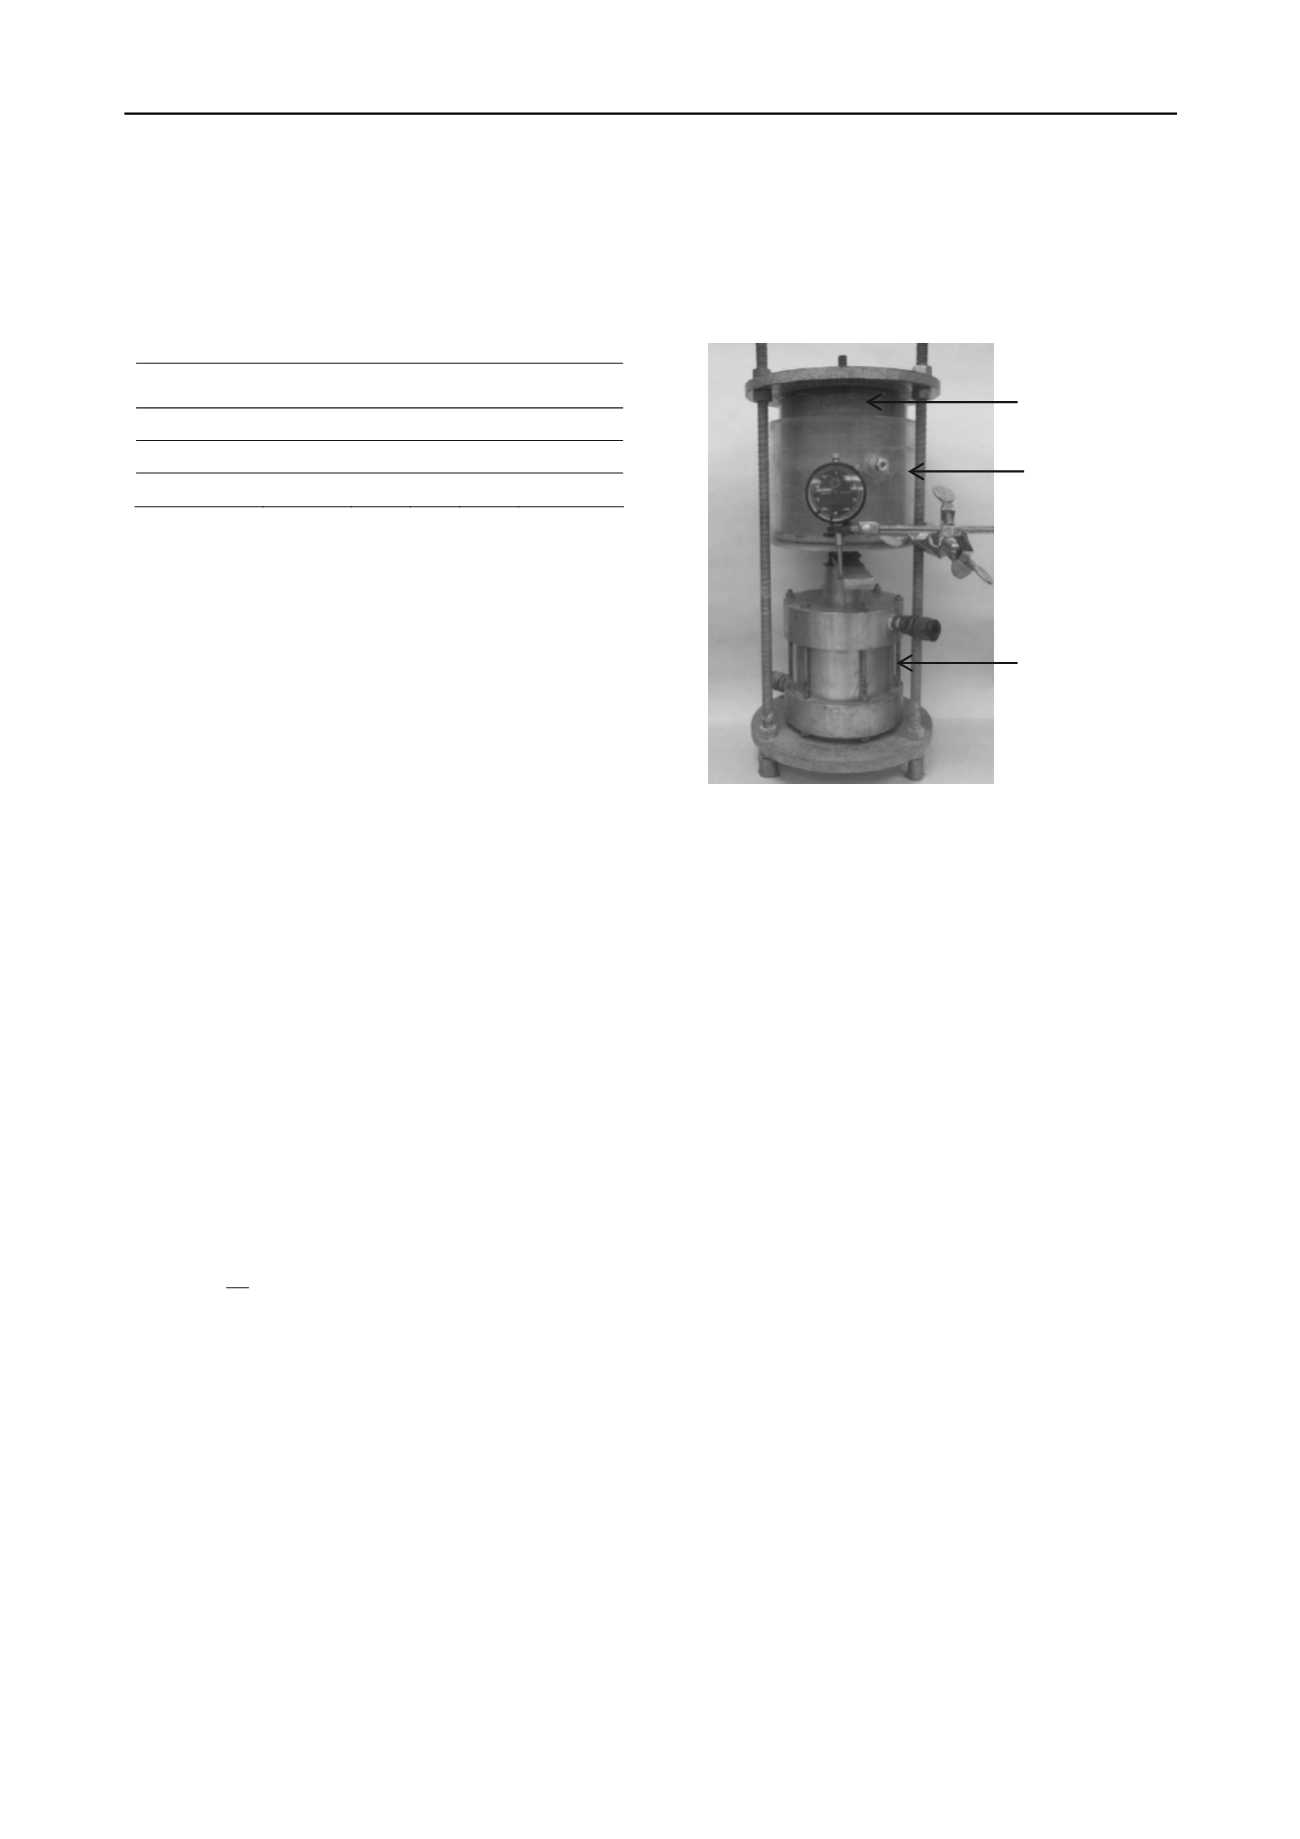
installed in a triaxial cell. For this reason, a batch of soil was
first consolidated in a batch consolidometer under K
o
conditions
to a vertical pressure of 38 kPa. The batch consolidometer used
in this investigation is shown in Figure 2. After the batch of soil
reached the end of primary consolidation, the sample was
extruded from the specimen container, and triaxial test
specimens were trimmed. The batch consolidometer formed
samples that had a diameter of 15 cm, which allowed five to six
3.6 cm diameter test specimens to be trimmed. The triaxial test
specimens were then installed in a triaxial cell, back pressure
saturated, and consolidated to an all-around pressure ranging
from 48 kPa to 483 kPa prior to shearing. The samples were
sheared slow enough to allow equilibration of the pore pressures
according to the criterion presented by Head (1986).
The results from the triaxial and direct shear tests performed
on remolded samples are presented in Figure 3. The envelopes
were clearly non-linear, and a power function was fit to the test
results. The power function used was consistent with the format
described by Lade (2010) (see Eq. 1).
b
a
a
'
a p
p
(1)
with:
′
= normal effective stress on the failure plane
p
a
= atmospheric pressure in the same units as
′.
a and b = curve fit parameters.
The results show that no significant differences were
obtained in the failure envelope determined with the direct shear
device and triaxial device for these remolded samples.
4 DISCUSSION
The difference in the results of the triaxial and direct shear tests
on undisturbed and remolded samples can be explained, in part,
by the difference in soil structure. The undisturbed tests
specimens obtained from the greater New Orleans area were
lacustrine and riverine alluvial deposits. These soils were
deposited in horizontal layers, and could be expected to have a
preferential structure. Upon visual inspection, the New Orleans
soils appear to be relatively homogenous. Distinct layering is
often not discernible. Shown on the left side of Figure 5 is a
section cut through an undisturbed New Orleans sample. The
right side of Figure 5 shows the same sample after drying. The
horizontal layers, which can represent planes of weakness,
become evident after drying.
Specimen
Container
Water Bath
Pneumatic
Piston
Figure 2. Batch consolidometer.
This horizontal layering can influence the shear strength
measured using the direct shear device. In the direct shear
device, the failure plane is horizontal. This forced failure plane
can sometimes coincide with the natural layering or planes of
weakness. In the triaxial device, the failure plane is not
predetermined by the configuration of the device and horizontal
planes of weakness would not be expected to control the
measured shear strength. The difference in shear strength as a
function of failure plane orientation has been documented by
many investigators (Duncan and Seed 1966a; b; Filz et al.
1992).
Remolding soil destroys any previous layering or structure
that might have been present, and the resulting sample is more
or less homogenous. The influence of the failure plane
orientation should be much less prevalent as compared to
undisturbed samples. This suggests that fully softened shear
strength (i.e. remolded normally consolidated peak shear
strength) might be less dependent on the choice of the test
apparatus than undisturbed shear strength.
5 CONCLUSIONS
The choice of using direct shear tests or triaxial tests to
determine drained shear strength parameters can be important
for natural soil deposits. Although these two different test
methods can often provide similar results in some soil deposits,
there is considerable evidence that direct shear tests provide
much lower friction angles in riverine and lacustrine alluvial
deposits than triaxial tests. A comparison of numerous CD
direct shear and CU triaxial test results conducted on alluvial
soils from the greater New Orleans area show that the friction
angle determined from the direct shear apparatus is normally
about 2 to 5 degrees lower than that determined using the
triaxial apparatus. This can be attributed to the anisotropic
shear strength characteristics of the alluvial soils.
The difference in the results of the two test devices is much
less when remolded test specimens are used. The remolding
process destroys the anisotropic fabric, and the shear strength
parameters are not as dependent on the orientation of the failure
plane. When fully softened shear strength parameters are
desired, direct shear and triaxial test apparatuses appear to
provide comparable results.


