315
Technical Committee 101 - Session II /
Comité technique 101 - Session II
Proceedings of the 18
th
International Conference on Soil Mechanics and Geotechnical Engineering, Paris 2013
a function of the confining pressure (
’
3
) and the void ratio (e)
ma be defined by the following expression:
y
E
i
=A
.
'
3
n.
e
-1
(1)
where A, n are constants that depend on the type of soil (Biarez
et al., 1993; Bard,1993).
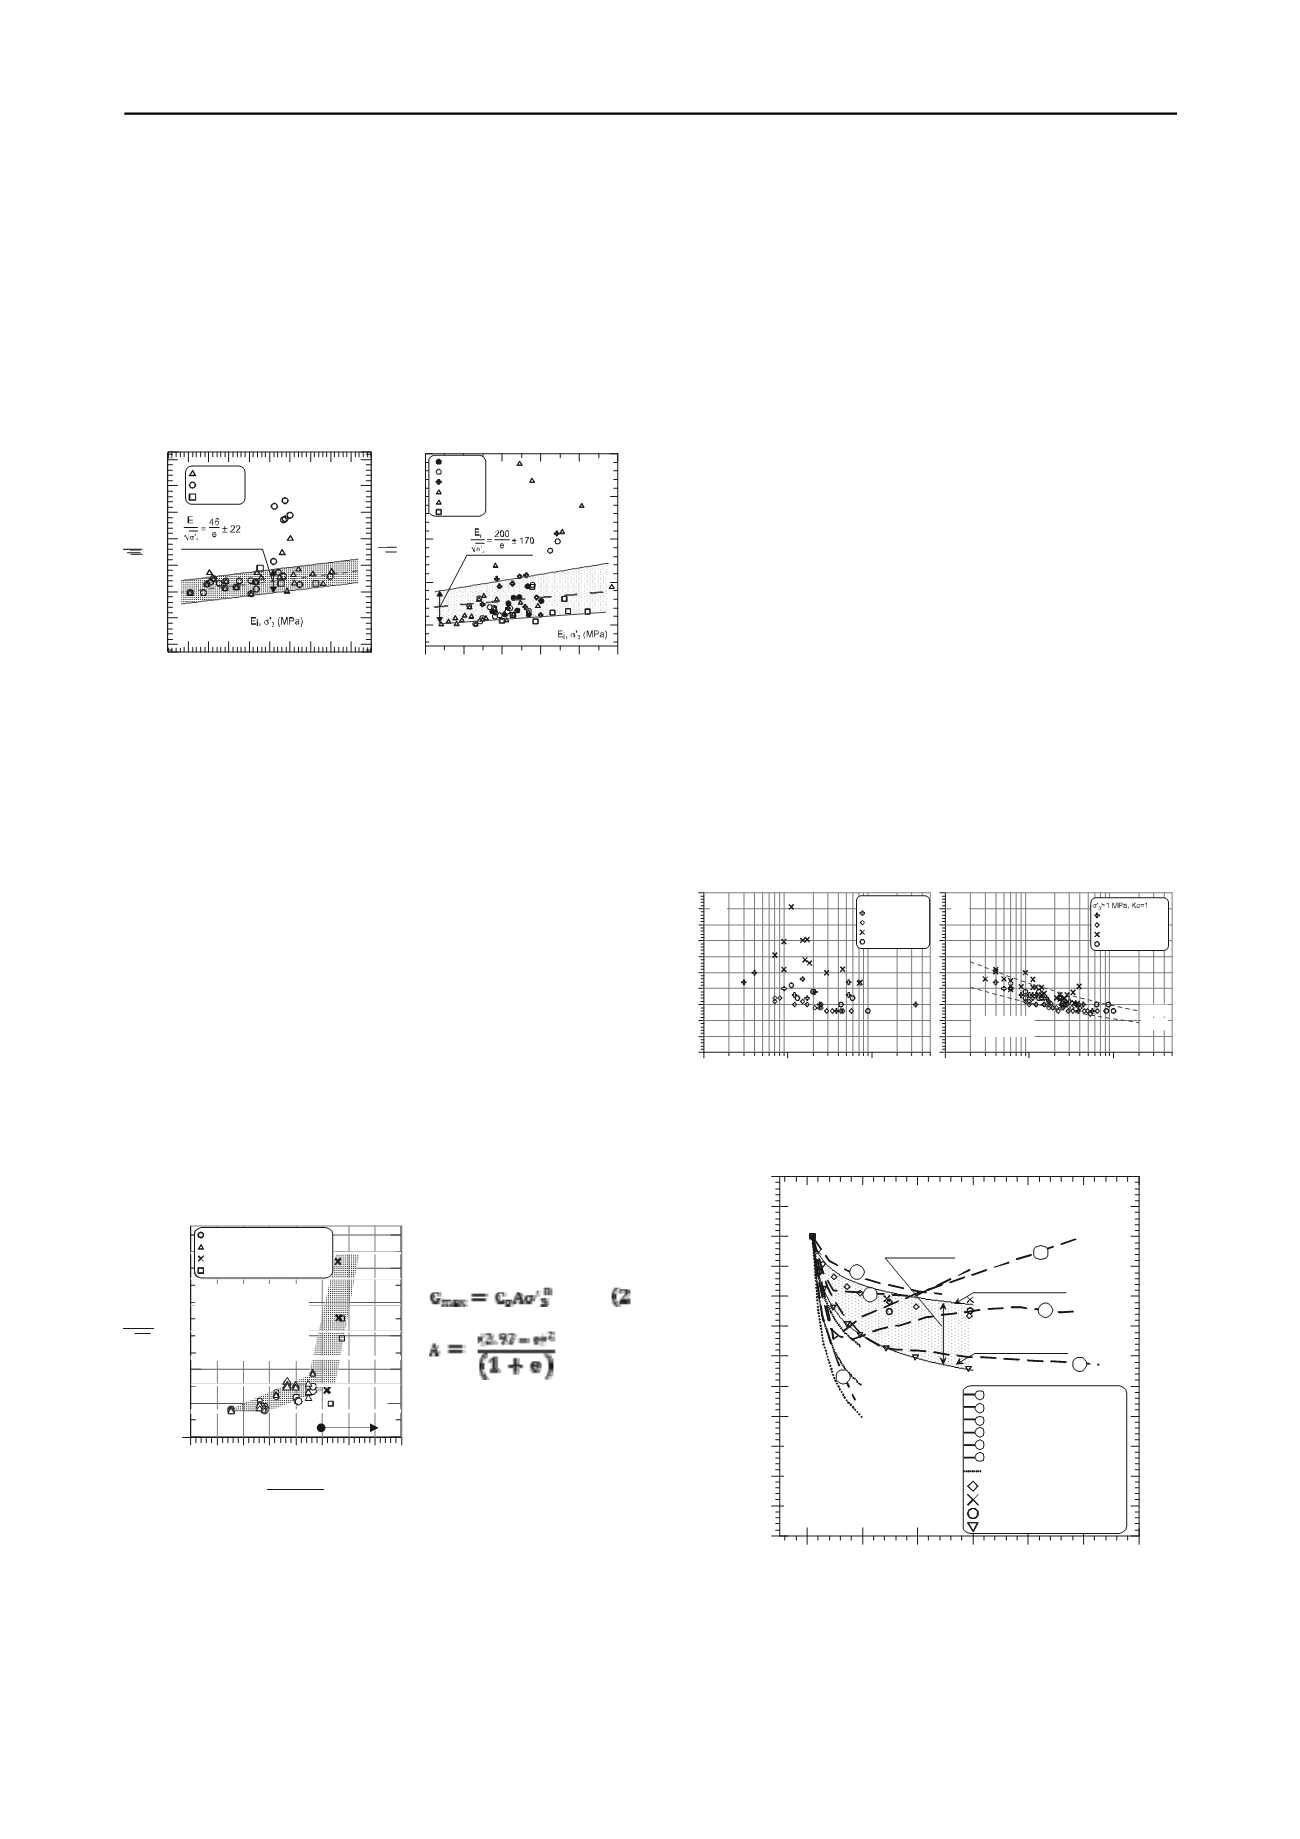
Figures 5a and 5b present the values of E
i
obtained through
the hyperbolic adjustment of the stress-deformation curves, for
the tests performed at different initial densities and different
fines contents in drained and undrained conditions (large
deformations).
1
1.2
1.4
1.6
1.8
2
1/e
-200
0
200
400
600
800
1000
E
i
'
3
18- 21% F
15% F
30% F
E
i
'
3
=
148
e ± 70
E
i
= Módulo Tangente Inicial
E
i
y
' 3 (kg/cm
2
)
-50
50
100
150
200
25
300
i
'
3
a)
1
1.2 1.4 1.6 1.8
2
1/e
0
500
1000
1500
2000
E
i
'
3
12% Fines
15% Fines
18% Fines
21% Fines
20% Fines
30% Fines
b)
Figure 5. Normalized E
i
variation. All the sands tested: a) drained case,
b) undrained (Campaña, 2011).
In case of the drained tests, the resulting values of E
i
are all
practically contained in a narrow band, even when the range of
fines content of the sample vary between 15% to 30%. In the
case of the undrained tests, a significant dispersion was
observed which may be explained by the variation of the pore
pressure according the initial value of
'
3
and density (e). The
lower values of E
i
correspond to 30% fines and the higher
values correspond to fines between 15% and 21%.
7 SHEAR MODULUS G
MAX
(
<10
-5
)
According to Hardin & Drnevich (1972), the variation of the
shear modulus at small deformations (G
max
) as a function of the
confining pressure
(
’
3
) and the void ratio
(e) may be expressed
as indicated by equation (2), where C
0
and n are constants of the
material. Plotting the results of the tests (triaxial at small
deformations in Sands S1 and S2; resonant column for S3) in
one graph to determine the values of C
0
and n of equation (2), it
was observed that, for the range of pressures and densities
tested, the tendency of expected variation for confining
pressures
'
3
<1 MPa is reproduced, which does not occur for
'
3
>1 MPa (Figure 6).
0
200
400
600
800
1000
1200
G
MAX
��
'
3
2.5
3
3.5
4
4.5
(2,97-e)
2
(1+e)
0
500
1000
1500
2000
2500
3000
3500
4000
'
0
18%F, Triaxial (S3)
18%F,C.Resonante(S3)
15%F, Triaxial (S1)
21%F, Triaxial (S1)
= [10 -6 - 10-5 ]
e=[0.52 - 0.73]
'
0
= [1 - 30 kg/cm
2
]
�
= [10 -
6
- 10-
5
]
e = [0.52 - 0.73]
�
'
3
= [0.1 to 2.94 MPa]
18 Fines, Sand S3 (triaxial test)
18 ines, Sand S3
(ResonantColumn)
15 Fines, Sand S3 (triaxial test)
21 Fines, Sand S3 (triaxial test)
Hardin & Drnevich (1972)
Figure 6. Results of resounding column and triaxial at small
deformations tests (Campaña, 2011).
8 CYCLIC SHEAR RESISTANCE (CSR)
The cyclic triaxial tests were carried out on reconstituted
samples with a nominal diameter of 5 cm (S1, S2 and S4) and
7 cm (S3) and nominal heights of 10 cm and 15 cm,
respectively. In all cases, parameter B at the end of the
applied according to the magnitude of isotropic confining
pressure: 0.3 MPa for Sands S1, S2, and S4 and up to 0.9 MPa
for Sand S3. A uniform sinusoidal cyclic load was applied with
a frequency of 0.1 Hz for Sand S4 and of 0.05 Hz for Sands S1,
S2, and S3. Test results are summarized in several graphs,
differentiated by the fines content, confining pressure, and
density achieved at the end of the consolidation stage (see
Campaña 2011). The results of this tests confirm the tendency
reported by Verdugo (1983) for lower confining pressures
(
’
3
≤ 0.5 MPa), related to the decrease of the required CSR to
produce liquefaction when the non-plastic fines content
increases. However, this tendency disappears for confining
pressures greater than 0.5 MPa where the CSR practically is a
constant. To strengthen this important detection, all the results
obtained have been plotted separately on Figure 7a for
’
3
≤ 0.5 MPa, and on Figure 7b, for
’
3
≥ 1 MPa. On Figure 6a,
a great scattering in the CSR values can be observed for the four
sands tested, while a general decreasing trend of CSR values
with the increasing number of cycles can be perceived. The
results corresponding to Sand S3 contribute significantly to the
width of the resulting band. Contrary, on Figure 6b for
’
3
≥1 MPa, the CSR values obtained range in a very narrow
band, without important differences due to initial density or
fines content or the cycloned tailings sands.
Another relevant aspect to point out from
saturation stage was greater than 0.95. Backpressure was
the results of the
tests carried out in Sands S2 and S4 for confining pressures
greater than 0.5 MPa, are the relatively constant CSR values
obtained despite the confining pressure applied (factor K
=1),
the fines content, the relative density, and even the initial shear
stress. Figure 8 presents a comparison of K
values obtained in
this paper with those obtained by several authors.
1
10
100
Número de Ciclos,N (
u=
'
0
)
0
0.1
0.2
0.3
0.4
0.5
Rc (
cy/
o')
'
3
10 (kg/cm
2
), Kc=1
ArenaS1
ArenaS2
ArenaS3
ArenaS4
Rc=A*N -
0.17
A=0.32
A=0.23
b)
Number of Cycles, N (
u=
'
3
)
Sa d
Sa d
Sa d
Sa d
0.5
1
10
100
Número de Ciclos, N (
u=
'
0
)
0
0.1
0.2
0.3
0.4
'
3
5 (kg/cm
2
),Kc=1
ArenaS1
Rc (
cy/
o')
ArenaS2
ArenaS3
' <0.5MPa,Kc=1
a)
CSR
=
cy
/
'
3
ArenaS4
Number of Cycles, N (
u=
'
3
)
CSR=A
.
N
-
0. 7
F 7. Summary all test results: a) for
’
3
≤ 0.5 MPa, b) for
igure
’
3
≥ 1MPa, Kc= 1.0 (Campaña, 2011)
0
1
2 3
4 5
'
3
(MPa)
6
0
0.1
0.2
0.3
0.4
0.5
0.6
0.7
0.8
0.9
1
1.1
1.2
K
Maureira (2012)
Santos (2011), 55% F
Solans (2010), 15% F, D
R
*=60
Riemer et al (2008), 15% F, 98% SP*
Seed & Harder (1990)
Vaid (1985)
Youd et. al (2001)
**
Sand S1 - 15% F - D
R
=49%
Sand S1 - 15% F - D
R
=56%
Sand S1 - 21% F - D
R
=56%
Sand S3 - 12 & 18% F - 56<D
R
<86%
This study range
K
=0.84(
'
3
)
-0.08
,[DR~50%]
1
K
=0.67(
'
3
)
-0.17
,[DR~70%]
4
5
6
3
2
D R <40%
DR~60%
DR>80%
1
2
3
5
6
4
D R : Relative Density after consolidation
D R *: before consolidation
SP: Standar Proctor
F : Fines content
** : Recommendation for natural sands
1996 & 1998 NCEER workshop
Tailing Sand Samples, except:
- Santos (2011), Tailing
- Seed & Harder (1990), Several natural sand
Figure 8. Variation of factor K
with regard to
’
3
9 CONCLUSIONS
The interpretation and analysis of the results of the testing
program show that, in the domain of confining pressures applied
DR>75%


