305
Bounding surface plasticity model parameters for Bagdad soils
Paramètres du modèle de plasticité de surface de délimitation pour les sols de Bagdad
Al-Farouk O., Al-Damluji S., Al-Shakarchi Y.J., Albusoda B.S.
University of Baghdad
A
BSTRACT: The attempt of this paper is to provide and determine essential properties and input parameters that the bounding
surface plasticity model requires and utilizes for Baghdad clay in order to be used in non-linear soil behavior analyses under
static and dynamic conditions. Site investigations were carried out and undisturbed samples of high quality were obtained from
the capital city at depths of 3-3.5 m, 5-5.5m and 7-7.5 m. A series of advanced soil laboratory tests were then performed under
K
0
-consolidated compression and extension conditions. The obtained soil laboratory test results were then used in a computer
algorithm in order to evaluate soil properties and compute input parameters for the Iraqi clayey soil that are required for the
bounding surface plasticity model.
RÉSUMÉ : La tentative de ce document est de fournir et de déterminer les propriétés essentielles ainsi que les paramètres requis
et utilisés dans le modèle de la plasticité de surface de délimitation pour les sols et argiles de Bagdad afin d’être utilisé dans les
analyses non linéaires de comportement des sols dans des conditions statiques et dynamiques.
Études et enquêtes sur le terrain ont été effectuées et des échantillons intacts de haute qualité à des profondeurs de (3 à 3,5 m), (5-
5,5 m) et de (7 à 7,5m) ont été obtenus des sols de la capitale (Bagdad).
Une série de tests de pointe du sol sous des conditions de compression et d’extension K
0
-consolidés ont ensuite été effectuées.
Les résultats obtenus en laboratoire des sols d’essai ont été ensuite utilisés dans un algorithme informatique afin d’évaluer les
propriétés du sol, et de calculer les paramètres d’entrée pour le sol argileux irakienne qui sont nécessaires pour le modèle de
plasticité de surface de délimitation.
1. ESTABLISHMENT OF MODEL PARAMETERS
1.1.
Introduction
The bounding surface plasticity model, as developed by
Dafalias and Herrmann (4.1), is a versatile constitutive
relation that can account for the behavior of clayey soils
under various loading conditions. It is currently well
established as a reliable algorithm for static and dynamic
applications on condition of adoption of appropriate input
parameters.
1.2.
Site investigation
A scheme was developed in order to obtain representative
high quality undisturbed and disturbed soil samples from
central Baghdad, the capital city of Iraq in order to obtain
the required input parametrs for the model.
1.3.
Drilling and sampling
Drilling is done by the use of continuous flight augers,
undisturbed samples are obtained by using Shelby tubes
and an appreciable amount of disturbed soil (enough for
conducting soil classification tests) is also extracted. The
samples obtained were waxed, sealed and transported to the
soil mechanics laboratory of the College of Engineering of
the University of Baghdad in order to conduct further
laboratory tests on them.
1.4.
Testing program and results
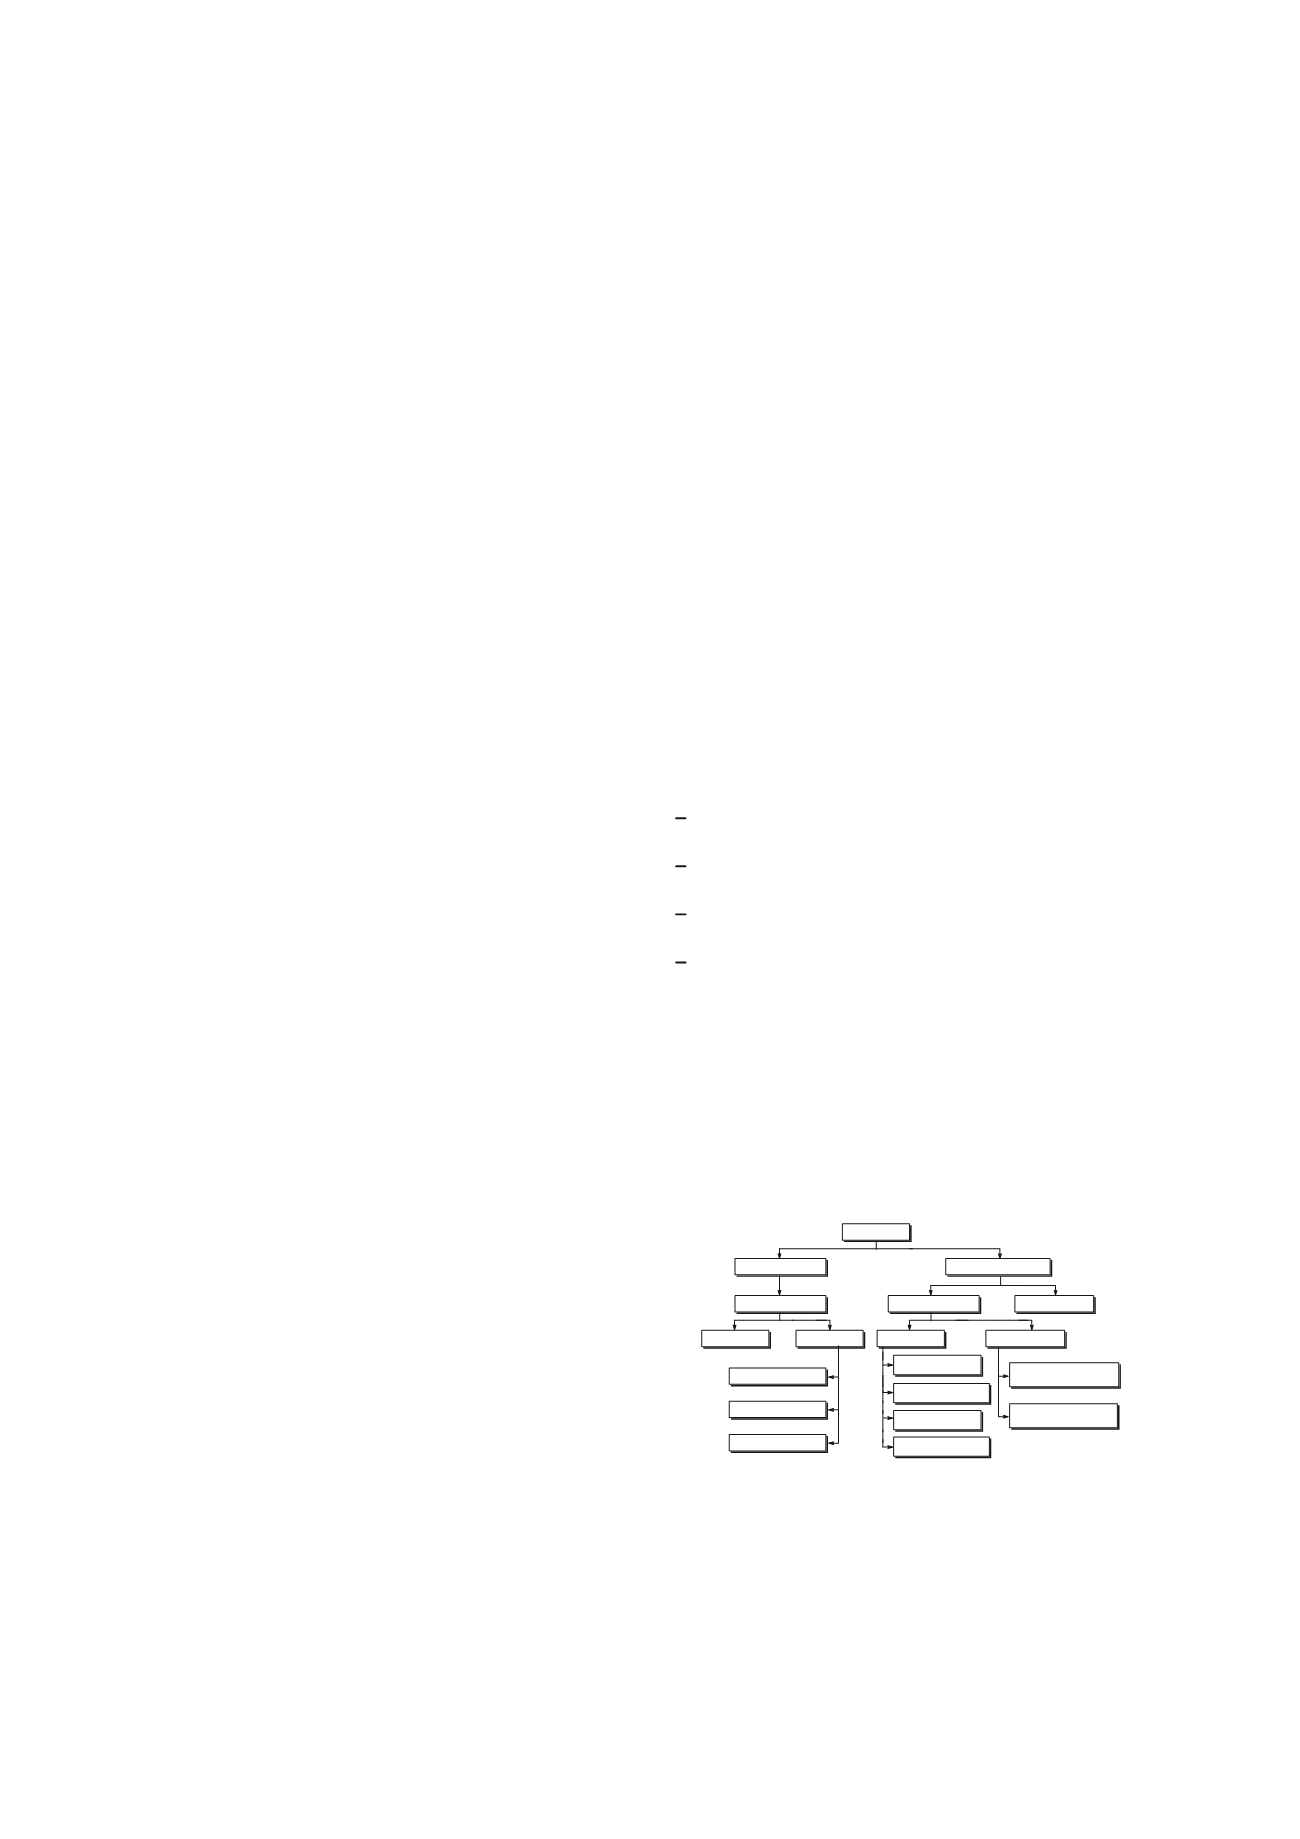
As shown in Figure (1), A series of classification,
engineering and ultrasonic tests are performed in this study.
Classification tests are conducted first, in addition to
physical and chemical tests. Physical tests comprise of
specific gravity, Atterberg limits, and hydrometer tests
while engineering tests that are carried out include standard
consolidation tests, cyclic consolidation tests and triaxial
tests according to the following conditions:
K
0
consolidated undrained triaxial compression tests
(K
0
CUCT
OCR
1 and 2).
K
0
consolidated undrained triaxial extension tests
(K
0
CUET
OCR
1).
Isotropically
consolidated
undrained
triaxial
compression tests (ICUCT
OCR
1, 1.2 and 5).
Isotropically
consolidated
undrained
triaxial
extension tests (ICUET
OCR
1, 1.2 and 5).
Figure 2 shows the soil type according to the Casagrande
chart, Table 1 summarizes the results of the ultrasonic tests
while Figures 3 and 4 show the conventional and cyclic
consolidation test results. Table 2 presents the results of
these consolidation tests. Plates 1 and 2 show the testing
setups for the triaxial tests, Figures 5 to 7 show the test
results and Table 3 shows the angle of internal friction
obtained from these triaxial tests.
SAMPLES
DISTURBEDSAMPLES
CLASSIFICATIONTESTS
CHEMICALTESTS
PHYSICALTESTS
SPECIFICGRAVITYTEST
ATTERBERGLIMITSTEST
HYDROMETERTEST
UNDISTURBEDSAMPLES
ENGINEERINGTESTS
ULTRASONICTESTS
TRIAXIALTESTS
OEDOMETERTESTS
CYCLICCONSOLIDATION
TEST
STANDARDCONSOLIDATION
TEST
K
0
CUET (OCR=1)
K
0
CUCT (OCR=1 and2)
ICUCT (OCR=1,1.2 and5)
ICUET (OCR=1, 1.2 and5)
Figure (1) The testing program.


