303
Technical Committee 101 - Session II /
Comité technique 101 - Session II
Proceedings of the 18
th
International Conference on Soil Mechanics and Geotechnical Engineering, Paris 2013
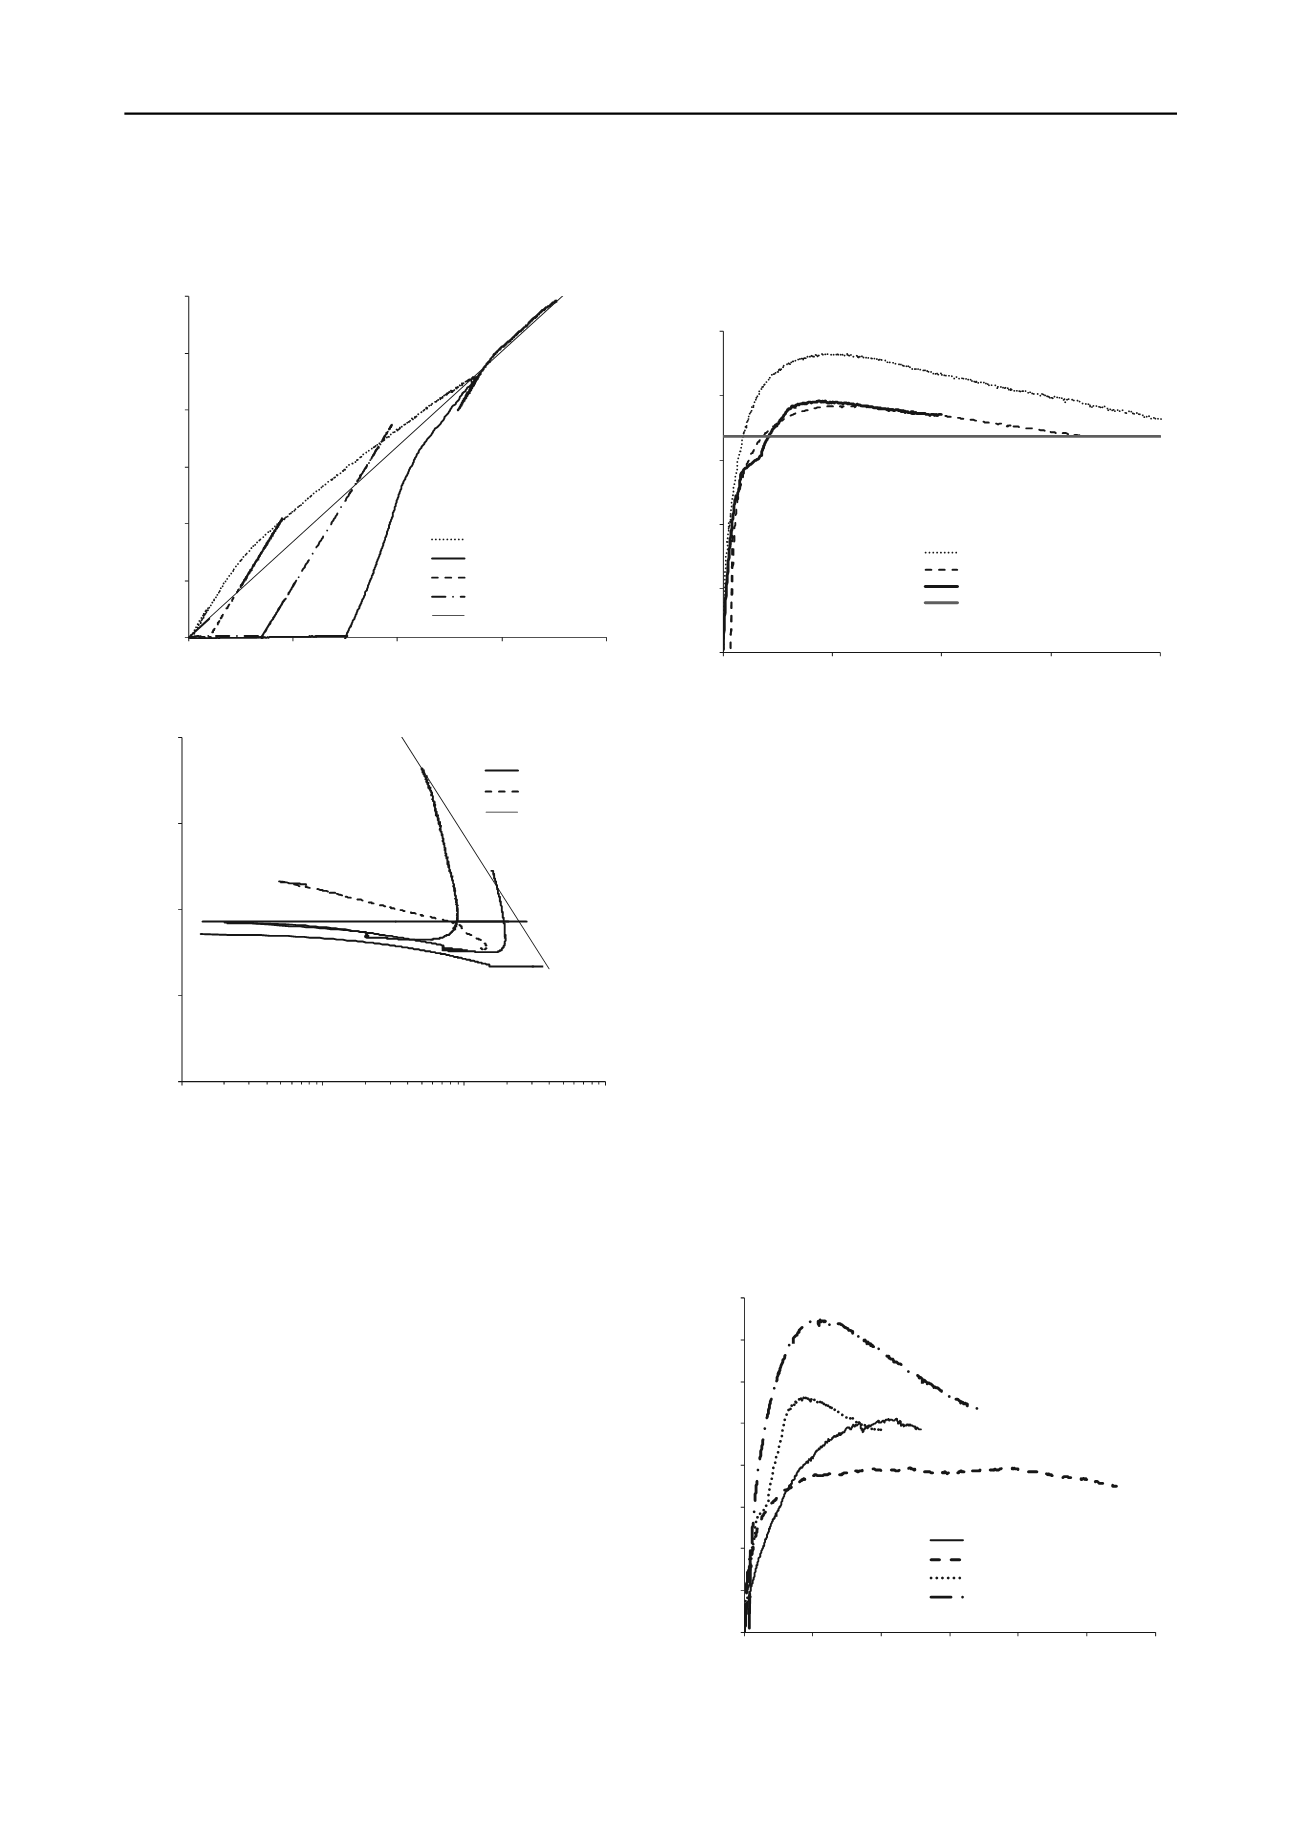
variations of the aggregate void ratio are inspected it can be
seen that these also provide support for a critical state line with
gradient
= 0.056.
Figure 3. Effective stress paths for DAC specimens.
Figure 4. Variation of aggregate void ratio for DAC specimens.
When the test with aggregate only is plotted on Fig. 4 it
appears that it does not reach the critical state line. However,
the aggregate only specimen formed a pronounced shear plane
and ruptured the membrane, and it is believed that if the test had
continued the specimen would have expanded and approached
the same ultimate locus as the asphalt specimens. It may also be
noted that the asphalt binder resulted in more uniform
deformations being observed in all the DAC specimens, which
tended to bulge out despite their dense and dilative nature.
Because different confining stresses have been used in the
drained tests for the asphalt specimens and the specimen
without the bitumen, the test results cannot be directly
compared. An alternative approach is to compare the stress ratio
(q/p′) versus axial strain responses as presented in Figure 5.
This shows that the specimen without the binder at an effective
confining stress of 500 kPa is behaving very similarly to the
asphalt specimen at 700 kPa. As discussed previously, and
shown in Figure 4, the asphalt specimens are slightly denser and
this can explain, at least part of, the difference in the behaviour
with stress level. The similarity of the shape of the responses
also suggests that the ultimate frictional resistance of the
aggregate is similar to that of the asphalt specimens, and as
expected the frictional resistance of the asphalt is controlled by
the aggregate. The results presented in Figures 1 to 5 all suggest
that the binder has only a minor effect on the stress-strain
response of the DAC asphalt specimens. At the slow loading
rates used in these tests the bitumen is simply acting as a
viscous pore fluid, and it is viscosity is sufficiently low for it to
flow out of the way of the aggregate to aggregate particle
interactions.
0
1000
2000
3000
4000
5000
6000
0
1000
2000
3000
4000
Deviator stress, q (kPa)
Mean effective stress, p' (kPa)
Undrained p'c = 50 kPa
Undrained p'c = 1500 kPa
Drained p'c = 200 kPa
Drained p'c = 700 kPa
M = 1.68
0
0.5
1
1.5
2
2.5
0
0.05
0.1
0.15
0.2
Stress ratio q/p'
Axial strain
DAC p'c = 200 kPa
DAC p'c = 700 kPa
Aggregateonlyp'c= 500 kPa
M= 1.68
0.15
0.2
0.25
0.3
0.35
10
100
1000
10000
Void ratio
Mean effective stress (kPa)
Asphaltspecimens
Aggregateonly
Critical state line
Figure 5. Stress ratio, strain responses in drained tests.
Tests have also been conducted on Stone Mastic Asphalt
(SMA) specimens. SMA is used in pavements as it is reported
to have better resistance to rutting, and this is believed to result
from the greater contact between the larger particles of
aggregate, which occurs because of the removal of some of the
intermediate particle sizes in the grading.
Figure 6 shows a comparison between the stress-strain
responses of the SMA and DAC specimens in drained tests.
This shows that there are significant differences between the
two asphalt materials. The SMA specimen has a peak deviator
stress only half that of the DAC specimen even though both
specimens have the same confining stress. This significant
reduction is not the result of differences in the aggregate void
ratio, which is essentially identical for the two materials, and
neither can it be explained by differences in the frictional
characteristics of the aggregate as the same aggregate is used for
both types of asphalt. However, the SMA aggregate only
specimen had a significantly higher void ratio, approximately
0.4, and this can explain why the SMA aggregate appears less
stiff and more compressible than the DAC aggregate.
Figure 7 shows the volume strains measured during the
drained tests shown in Figure 6. The DAC specimen is
significantly more dilative than the SMA specimen even though
the specimens are compacted with similar energies and with
0
500
1000
1500
2000
2500
3000
3500
4000
0
0.05
0.1
0.15
0.2
0.25
0.3
Deviator stress (kPa)
Axial strain
SMAaggregate onlyp'c = 500 kPa
SMAp'c = 700 kPa
DAC aggregate onlyp'c = 500kPa
DAC p'c = 700 kPa
Figure 6. Comparison of SMA and DAC materials in drained tests.


