306
Proceedings of the 18
th
International Conference on Soil Mechanics and Geotechnical Engineering, Paris 2013
0
10
20
30
40
50
60
70
80
90 100
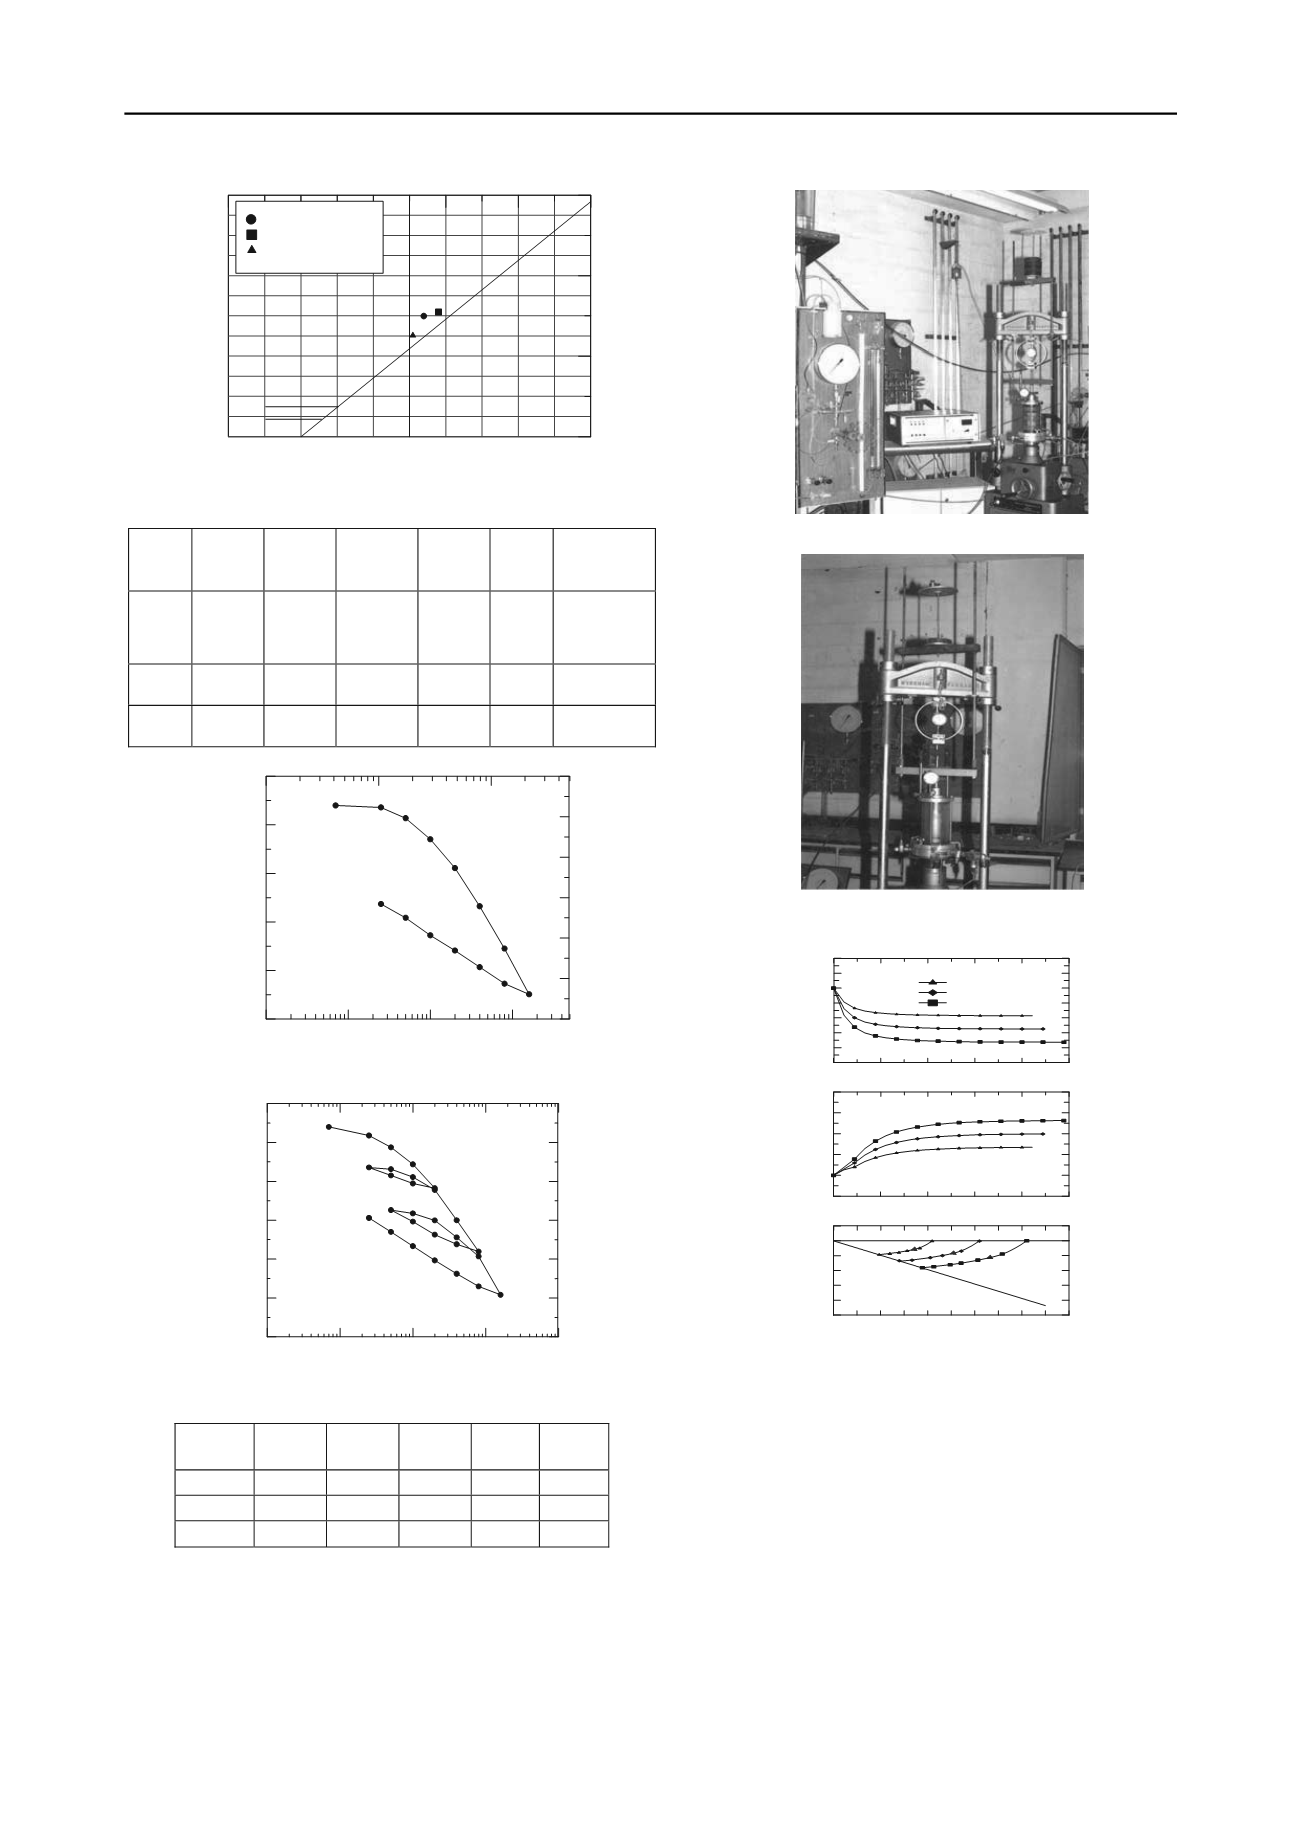
Liquid Limit (%)
0
10
20
30
40
50
60
Plasticity Index (%)
A-line
CL
CH
MH or OH
CL-ML ML or OL
Depth=3-3.5m
Depth=5-5.5m
Depth=7-7.5m
7
4
Figure 2. Soil type using Casagrande chart.
Table (1) Results of ultrasonic tests
Dept
h (m)
p
(m/sec
)
s
(m/sec
)
E
(kP
a
)
G
(kP
a
)
K
(kP
a
)
3-3.5
412
134 1.01
10 35104
0.44
2.85
10
5
5-5.5
1238 516 1.4
10
6
51121
2
0.40
2.26
10
6
7-7.5
966
998 1.28
10 48360
8
0.32
1.17
10
6
1
10
100
1000
Stress (kPa)
0.45
0.50
0.55
0.60
0.65
0.70
Void Ratio (e)
Figure 3. Results of a Standard Consolidation Test at Depth
(5-5.5 m).
1
10
100
1000
10000
Stress (kPa)
0.40
0.45
0.50
0.55
0.60
0.65
0.70
Void Ratio (e)
Figure 4. Results of a cyclic consolidation test at depth (5-5.5 m)
Table (2) Results of standard consolidation tests
Depth
(m)
C
c
C
s
P
c
P
o
OCR
3-3.5 0.162 0.001 250 47.5 5.26
5-5.5 0.156 0.037 115 68.7 1.67
7-7.5 0.300 0.048 155 145.5 1.065
Plate .1. Triaxial setup for anisotropic consolidation.
Plate 2. Complete triaxial setup for extension test.
0
2
4
6
8
10
Axial Strain (%)
-250
-200
-150
-100
-50
0
50
100
DeviatoricStress(kPa)
0
2
4
6
8
10
Axial Strain (%)
-50
0
50
100
150
200
P.W.P(kPa)
0 50 100 150 200 250 300 350 400 450 500
p (kPa)
-250
-200
-150
-100
-50
0
50
q(kPa)
K -line
Effective Confining Pressure (kPa)
210
310
410
f
-
-
Figure .5. Results of isotropically consolidated undrained triaxial
extension tests at depth (5-5.5 m).


