302
Proceedings of the 18
th
International Conference on Soil Mechanics and Geotechnical Engineering, Paris 2013
Proceedings of the 18
th
International Conference on Soil Mechanics and Geotechnical Engineering, Paris 2013
cylindrical specimens were then subjected to conventional CIU
and CID triaxial tests.
Table 1. Particle size distributions.
Sieve Size
DAC
(%)
SMA
(%)
19.0
100.00
100.00
13.2
99.00
90.24
9.5
83.38
50.06
6.7
66.74
30.98
4.75
56.81
24.14
2.36
39.97
20.78
1.18
27.44
17.92
0.60
20.74
15.79
0.30
11.79
13.04
0.15
7.69
11.53
0.075
5.92
10.27
Filler/Binder
1.15
1.55
Bitumen
5.17
6.64
Table 2. Mix proportions.
Aggregate
DAC %
SMA%
14mm Basalt
19.8
57.98
10mm Basalt
19.4
14.22
7mm Basalt
6.40
0.00
Basalt Dust
35.1
9.52
Benedict's
Glass Sand
13
3.27
Hydrated Lime
1.14
5.24
Finely Ground
Limestone
-
2.97
Cellulose
Fibres
-
0.28
C450 Bitumen
5.20
6.50
Additional triaxial tests have been performed on aggregate
specimens with identical gradings to the asphalt specimens,
except for the absence of the bitumen. These specimens were
100 mm in diameter by 200 mm tall, and were prepared by
tamping the moist aggregate mixture into a split mould located
on the triaxial base platen.
The asphalt specimens had nominal air voids of 5.5% and
very low permeability. To saturate the specimens elevated back
pressures of between 600 kPa to 1000 kPa were used, but even
so several days were required for the rate of water inflow to
drop below 3 mm
3
/min at which stage the specimens were
considered to be effectively saturated.
2 RESULTS AND DISCUSSION
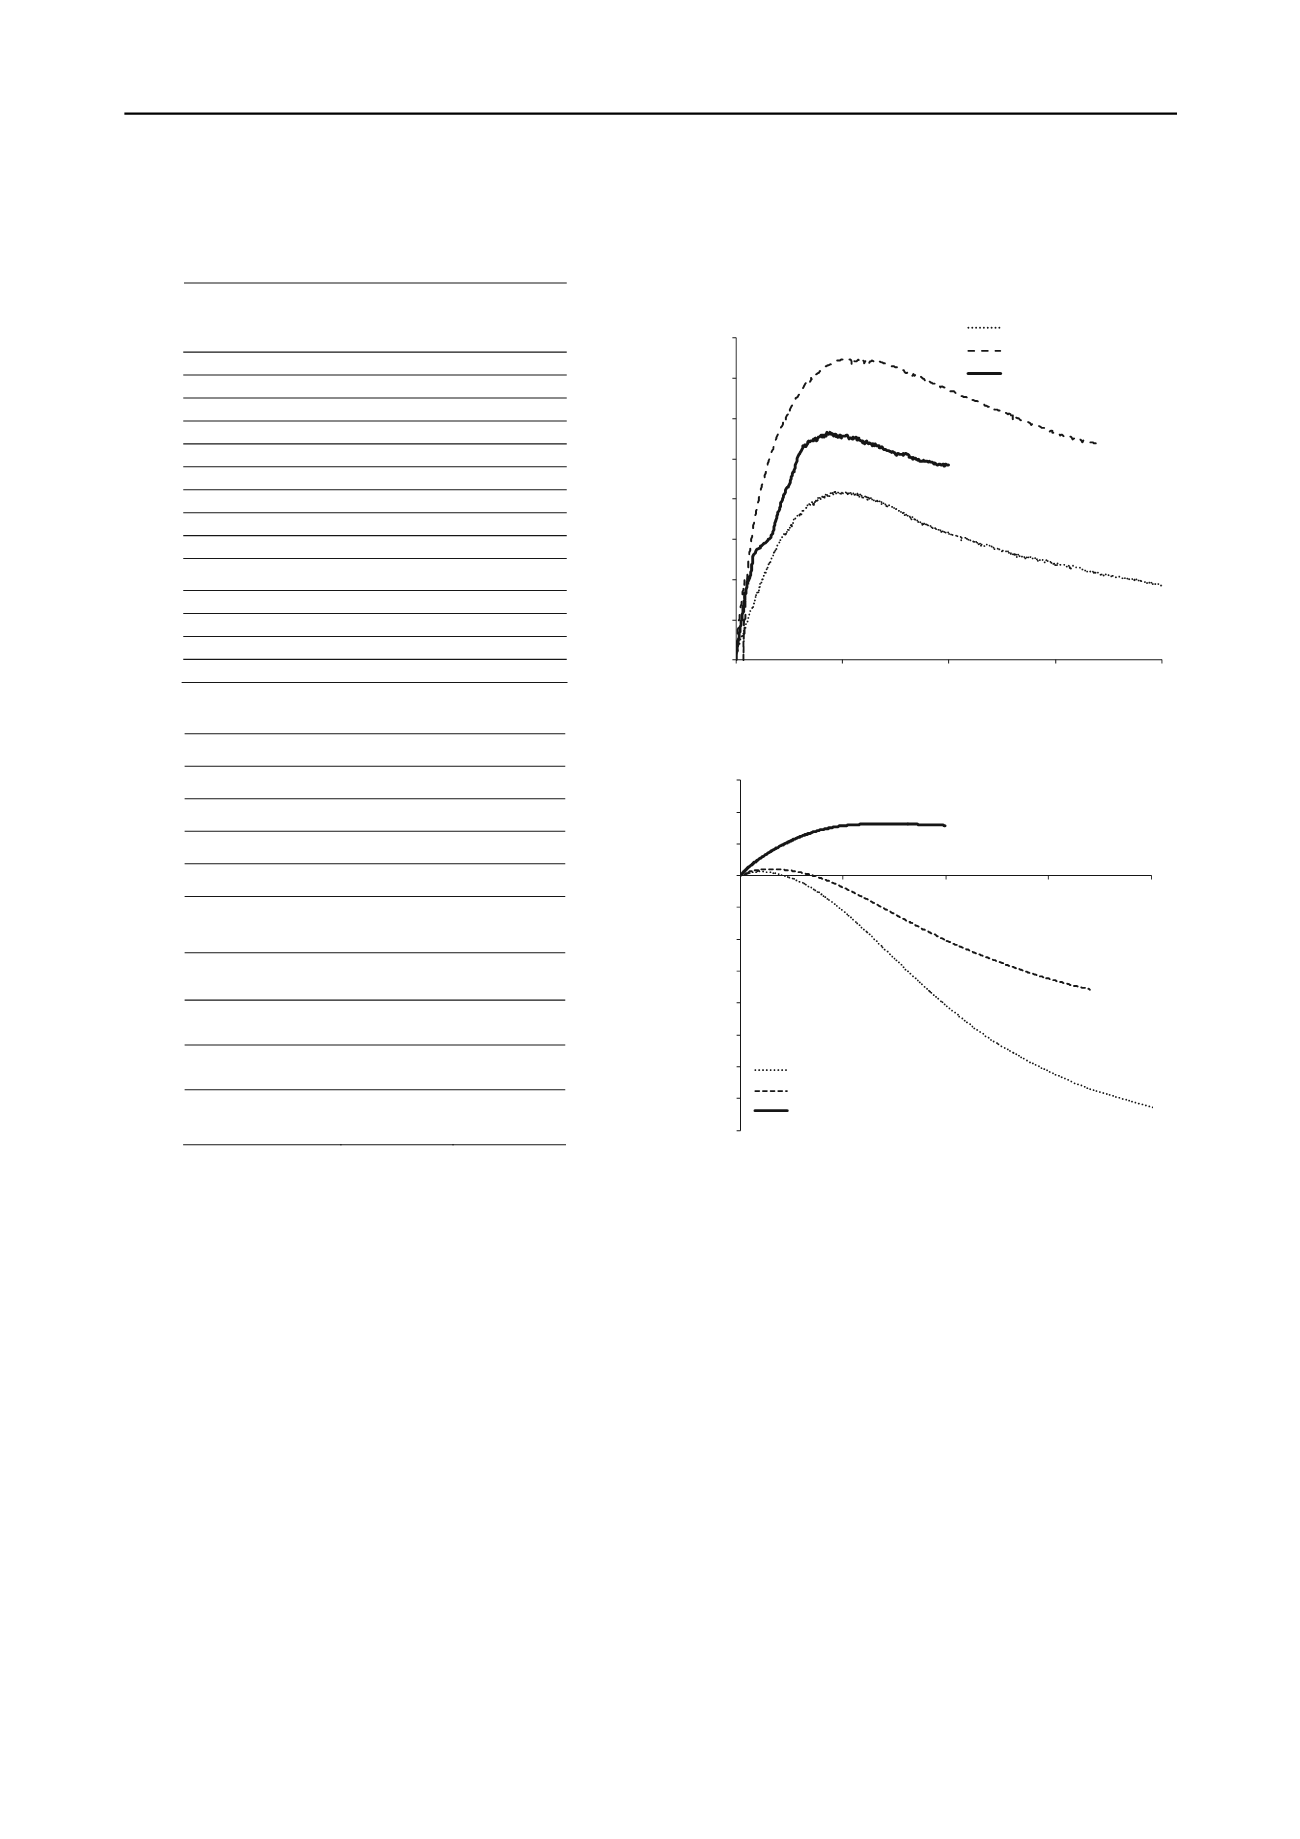
The results of drained triaxial tests on the DAC mix are shown
in Figures 1 and 2. These figures compare the response of
asphalt specimens isotropically compressed to 200 kPa and 700
kPa, with a specimen comprised only of the aggregate
compressed to 500 kPa.
Figure 1 shows that the differences between the two asphalt
(DAC) specimens and the aggregate only specimen are
primarily due to the different effective stress levels, and that the
effects of the bitumen on the stress-strain response are relatively
minor for these tests, which were conducted at a strain rate of
0.5%/hr. From the volume strain responses shown in Figure 2 it
is evident that the asphalt specimens are more dilative. This is a
consequence of the asphalt specimens being denser than the
aggregate only specimen.
0
500
1000
1500
2000
2500
3000
3500
4000
0
0.05
0.1
0.15
0.2
Deviator stress (kPa)
Axial strain
DAC p'c = 200 kPa
DAC p'c = 700 kPa
Aggregate only p'c = 500 kPa
Figure 1. Deviator stress, strain responses from drained tests of DAC.
-0.08
-0.07
-0.06
-0.05
-0.04
-0.03
-0.02
-0.01
0.00
0.01
0.02
0.03
0
0.05
0.1
0.15
0.2
Volume strain
Axial strain
DAC p'c = 200 kPa
DAC p'c = 700 kPa
Aggregate only p'c = 500 kPa
Figure 2. Volume strains from drained tests on DAC.
From a soil mechanics perspective the behaviour of the
asphalt might be expected to depend on the void ratio, but for
the asphalt specimens where the voids are mostly filled with
bitumen a number of definitions of void ratio can be employed.
The results presented in Figures 1 and 2 show the bitumen has
little influence on the stress- strain response which suggests that
the definition of void ratio should include the space filled by the
bitumen as well as the water. For the asphalt specimens this
results in a value of approximately 0.24 for the aggregate void
ratio, e
agg
. However, if the bitumen is included with the solids
then a much lower void ratio of 0.08 is obtained. If the bitumen
makes no contribution to the strength of the material then we
might expect to observe a unique critical state line, using the
aggregate void ratio, e
agg
, which is unaffected by the presence of
the bitumen. This is explored in Figures 3 and 4. Figure 3 shows
the effective stress paths in deviator stress,
q
, versus mean
effective stress,
p′
, from several asphalt specimens subjected to
both drained and undrained tests, and Figure 4 shows the
resulting changes in aggregate void ratio. It can be observed that
the asphalt specimens behave as expected for dense granular
materials, with significant dilation at low effective stresses and
with the effects of dilation diminishing as the effective stress
level increases. All specimens approach a unique critical state
line described by M = 1.68, a friction angle of 41
o
. When the


