322
Proceedings of the 18
th
International Conference on Soil Mechanics and Geotechnical Engineering, Paris 2013
Proceedings of the 18
th
International Conference on Soil Mechanics and Geotechnical Engineering, Paris 2013
bender/extender elements tests were carried out considering
four porosities and five cement contents at four distinct curing
time periods (1, 3, 5 and 7 days).
2.1. Materials
The Osorio sand used in the testing was obtained from the
region of Porto Alegre, in Southern Brazil, being classified as
non-plastic uniform fine sand. Specific gravity of the solids is
2.63. Mineralogical analysis showed that sand particles are
predominantly quartz. The grain size is purely fine sand with a
mean diameter of 0.16 mm, being the uniformity and curvature
coefficients of 1.9 and 1.2, respectively. The minimum and
maximum void ratios are 0.6 and 0.9, respectively.
Portland cement of high early strength (Type III) was used
as the cementing agent. Its fast gain of strength and stiffness
allowed the adoption of 1, 3, 5 and 7 days as the curing time
periods. The specific gravity of the cement grains is 3.15.
Distilled water was used for these characterization tests and
tap water for molding specimens for the compression tests.
2.2. Methods
Molding and curing of specimens, as well as bender element
tests are detailed below.
2.2.1.
Molding and curing of specimens
For the for the bender element tests, cylindrical specimens
70mm in diameter and 140mm high were used. A target dry unit
weight for a given specimen was then established through the
dry mass of soil-cement divided by the total volume of the
specimen. In order to keep the dry unit weight of the specimens
constant with increasing cement content, a small portion of the
soil was replaced by cement. As the specific gravity of the
cement grains (3.15) is greater than the specific gravity of the
soil grains (2.63), for the calculation of porosity, a composite
specific gravity based on the soil and cement percentages in the
specimens was used.
After the soil, cement and water were weighed, the soil and
cement were mixed until the mixture acquired a uniform
consistency. The water was then added continuing the mixture
process until a homogeneous paste was created. The amount of
cement for each mixture was calculated based on the mass of
dry soil and the moisture content. The specimen was then
statically compacted in three layers inside a cylindrical split
mold, which was lubricated, so that each layer reached the
specified dry unit weight. The top of each layer was slightly
scarified. After the molding process, the specimen was
immediately extracted from the split mold and its weight,
diameter and height measured with accuracies of about 0.01g
and 0.1mm, respectively. The samples were then placed inside
plastic bags to avoid significant variations of moisture content.
They were cured in a humid room at 23º±2ºC and relative
humidity above 95%. The samples were considered suitable for
testing if they met the following tolerances: Dry unit weight
(
d
): degree of compaction between 99% and 101% (the degree
of compaction being defined as the value obtained in the
molding process divided by the target value of
d
); Dimensions:
diameter to within ±0.5mm and height ±1mm.
The molding points were chosen considering relative
densities of 10%, 33%, 66% and 90%, with the same moisture
content (about 10%). Each point was molded with five different
cement percentages: 1%, 2%, 3%, 5% and 7%. These
percentages were chosen considering the Brazilian and
international experience with soil-cement [e.g., Mitchell (1981),
Consoli
et al.
(2010, 2012b)], both in experimental and practical
work.
2.2.2.
Bender/extender element tests
T-shaped pairs of bender/extender (BE) elements, installed on
the top and bottom specimen platens, were used in present study
for emission and reception of shear “S” waves (2 to 20 kHz
frequencies) and compression “P” waves (20 to 80 kHz
frequencies), being directly related to shear and oedometric
moduli measurement, respectively. The bender/extender
elements penetrated the specimen by 3mm at each end. For
present sand-cement mixtures, time domain method of
identification of first arrivals was adopted.
Single sine-wave input pulses were used at pre-set
frequencies of 1, 3, 5, 7, 9, 11, 13 kHz, which covered the range
of resonant frequencies of the sample-BE system. The output
signals were captured on an oscilloscope, directly transferred to
the PC and plotted to a common time base. The first arrival of
the shear wave was taken (on the basis of previous calibration)
as the point at which the wave descended, with low noise higher
frequency results being preferred in order to avoid near field
effects.
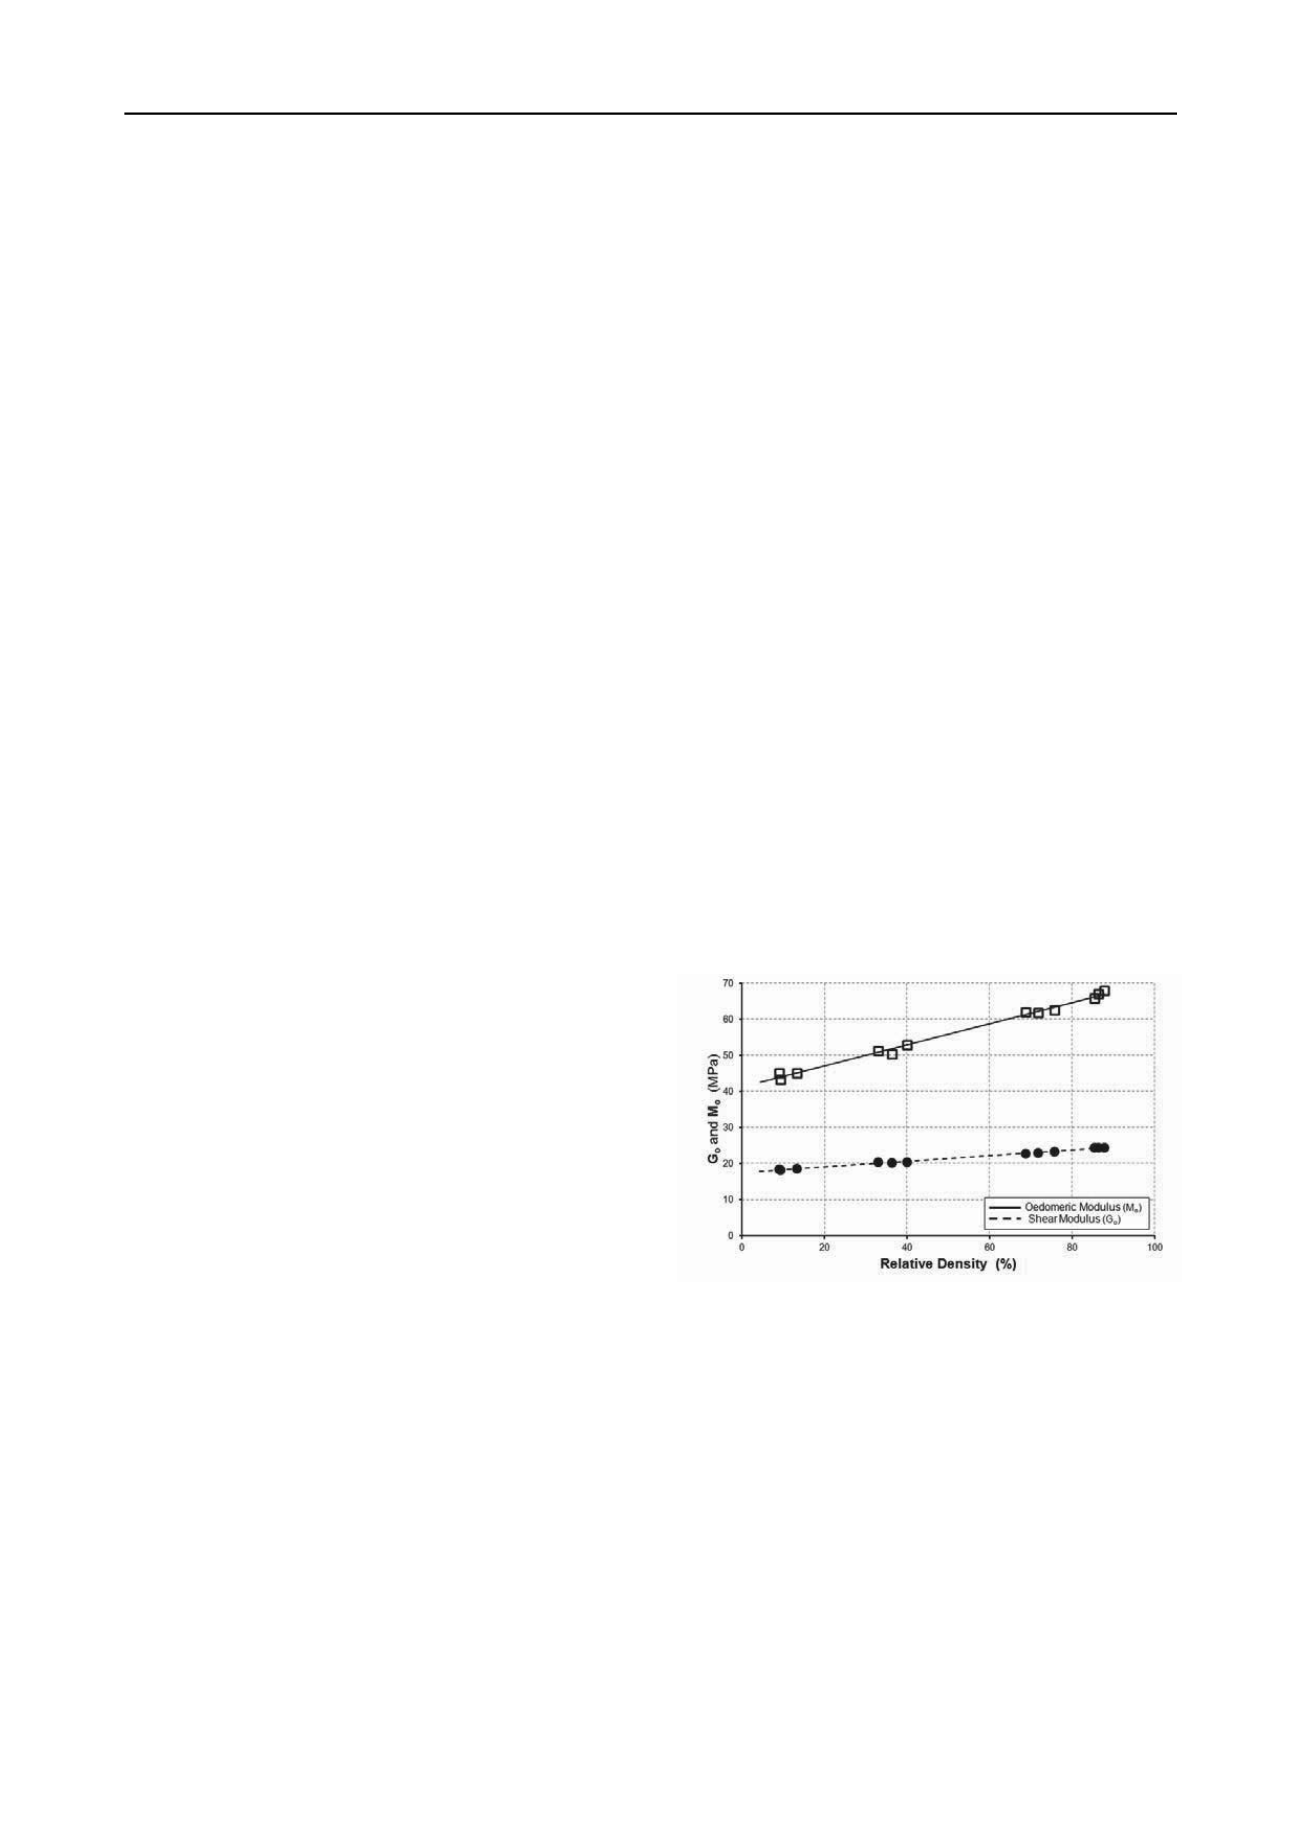
3 RESULTS OF STIFFNESS MEASUREMENTS
Results of both initial shear (G
o
) and initial oedometric (M
o
)
moduli versus relative density (DR) of Osorio sand are
presented in Figure 1. Equations (1) and (2), fitted from
experimental data, give the expressions of G
o
and M
o
with
relative density of Osorio sand.
DR
MPa
G
sand
o
076 .0 60.17 )
(
(1)
DR
MPa
M
sand
o
294 .0 18.41 )
(
(2)
Figure 1. Shear (G
o
) and oedometric (M
o
) moduli versus relative density
for Osorio sand.
Results of G
o
and M
o
on artificially cemented are also
presented in Figures 2, 3, 4 and 5, respectively for, 1, 3, 5 and 7
curing days.
Figure 2 presents the variation of the shear (G
o
) and
oedometric (M
o
) modulus with porosity/cement ratio (
/C
iv
)
considering all four studied relative densities (10, 33, 66 and
90%), five cement contents (1%, 2%, 3%, 5% and 7%) and 1
(one) day of curing. Equations (3) and (4) present the variation
of G
o
and M
o
with
/C
iv
, both with high coefficient of
determination (R
2
=0.95 and 0.93, respectively for shear and
oedometric modulus).


