332
Proceedings of the 18
th
International Conference on Soil Mechanics and Geotechnical Engineering, Paris 2013
Proceedings of the 18
th
International Conference on Soil Mechanics and Geotechnical Engineering, Paris 2013
4
Factors G and S may be different between the full-scale backfill
and the one used in laboratory stress-strain tests.
To evaluate factors S and G, a series of drained TC tests were
performed using small and large CMG specimens of the same
gravelly soil but having four different grading curves, PG, SAG,
CG and OBG shown in Fig. 1, produced from an original
gravelly soil (OBG), a sub-angular crushed sandstone as Chiba
gravel but from another quarry. Among these sieved materials,
SAG was produced just by removing particles larger than 10 mm.
The fact that SAG is easiest to produce is a strong advantage for
the use in tests performed in practice. On the hand, PG is
extremely time-consuming to produce, as a large amount of fine
particles should be produced. So, the use of this material in
practice cannot be recommended. The production of CG is
intermediate. The compaction curves of these sieved materials
are noticeably different due to different grading curves (Fig. 2b).
The small specimens have the same size as those of which the
data are presented in the preceding sections. The large specimens
are 300 mm in diameter and 580 mm in height. All the specimens
were prepared under the same conditions: i.e.,
c/g
= 4.0 % and
D
c
= 95 % at the respective optimum water contents by 4.5E
c
. As
the
ρ
d_max
values of these sieved materials are nearly the same
(Fig. 2b), the eventually obtained compacted dry densities are
very similar.
0 20 40 60 80 100 120 140
0.0
4.0
8.0
12.0
16.0
ML TC tests (specimen from Kikonai site)
D
c
=100% (4.5Ec); c/g=3.0%;
h
'=20kPa
Bottom of bridge abutment (boring)
Top of bridge abutment (core-cut)
Fitting based on Eq. (3)
Using the parameters deduced by:
Method 1): q
0
= 1.61
a= 6.7; or
Method 2): a= 7.7
q
0
= 1.43 MPa
Maximum deviator stress q
max
(MPa)
Time (day)
28 days
Figure 7. Compressive strength
q
max
versus total curing time for rotary
core samples from the field (Kikonai GRS integral bridge) and fitting
curve based on Eq. (3) with a set of deduced parameters (Fig. 6a and b)
0.0
0.5
1.0
1.5
0.0
2.0
4.0
6.0
Small TC (SAG)
Small TC (PG)
Large TC (OBG)
Deviator stress, q (MPa)
Vertical strain,
v
(%)
ML TC test -
h
'=20kPa
Cured for 7 days
D
c
=95%(4.5Ec) c/g=4.0%
v
=0.03%/min
Large TC (SAG)
Small TC (CG)
Figure 8. Deviator stress (
q
)
–
vertical strain (
v
) relations from CD TC
tests at
h
’=20
kPa on small and large specimens having different types
of cement-mixed gravel presented in Fig. 1
Fig. 8 shows the stress-strain curves at
t
c
= 7 days of the small
and large specimens of SAG, CG and OBG. The effects of
specimen size (factor S) are significant, while the effects of
grading characteristics (factor G) are not so. It was found that
there is no trend in the relationship between
q
max
and
D/d
50
(also
with
D/d
ma
x
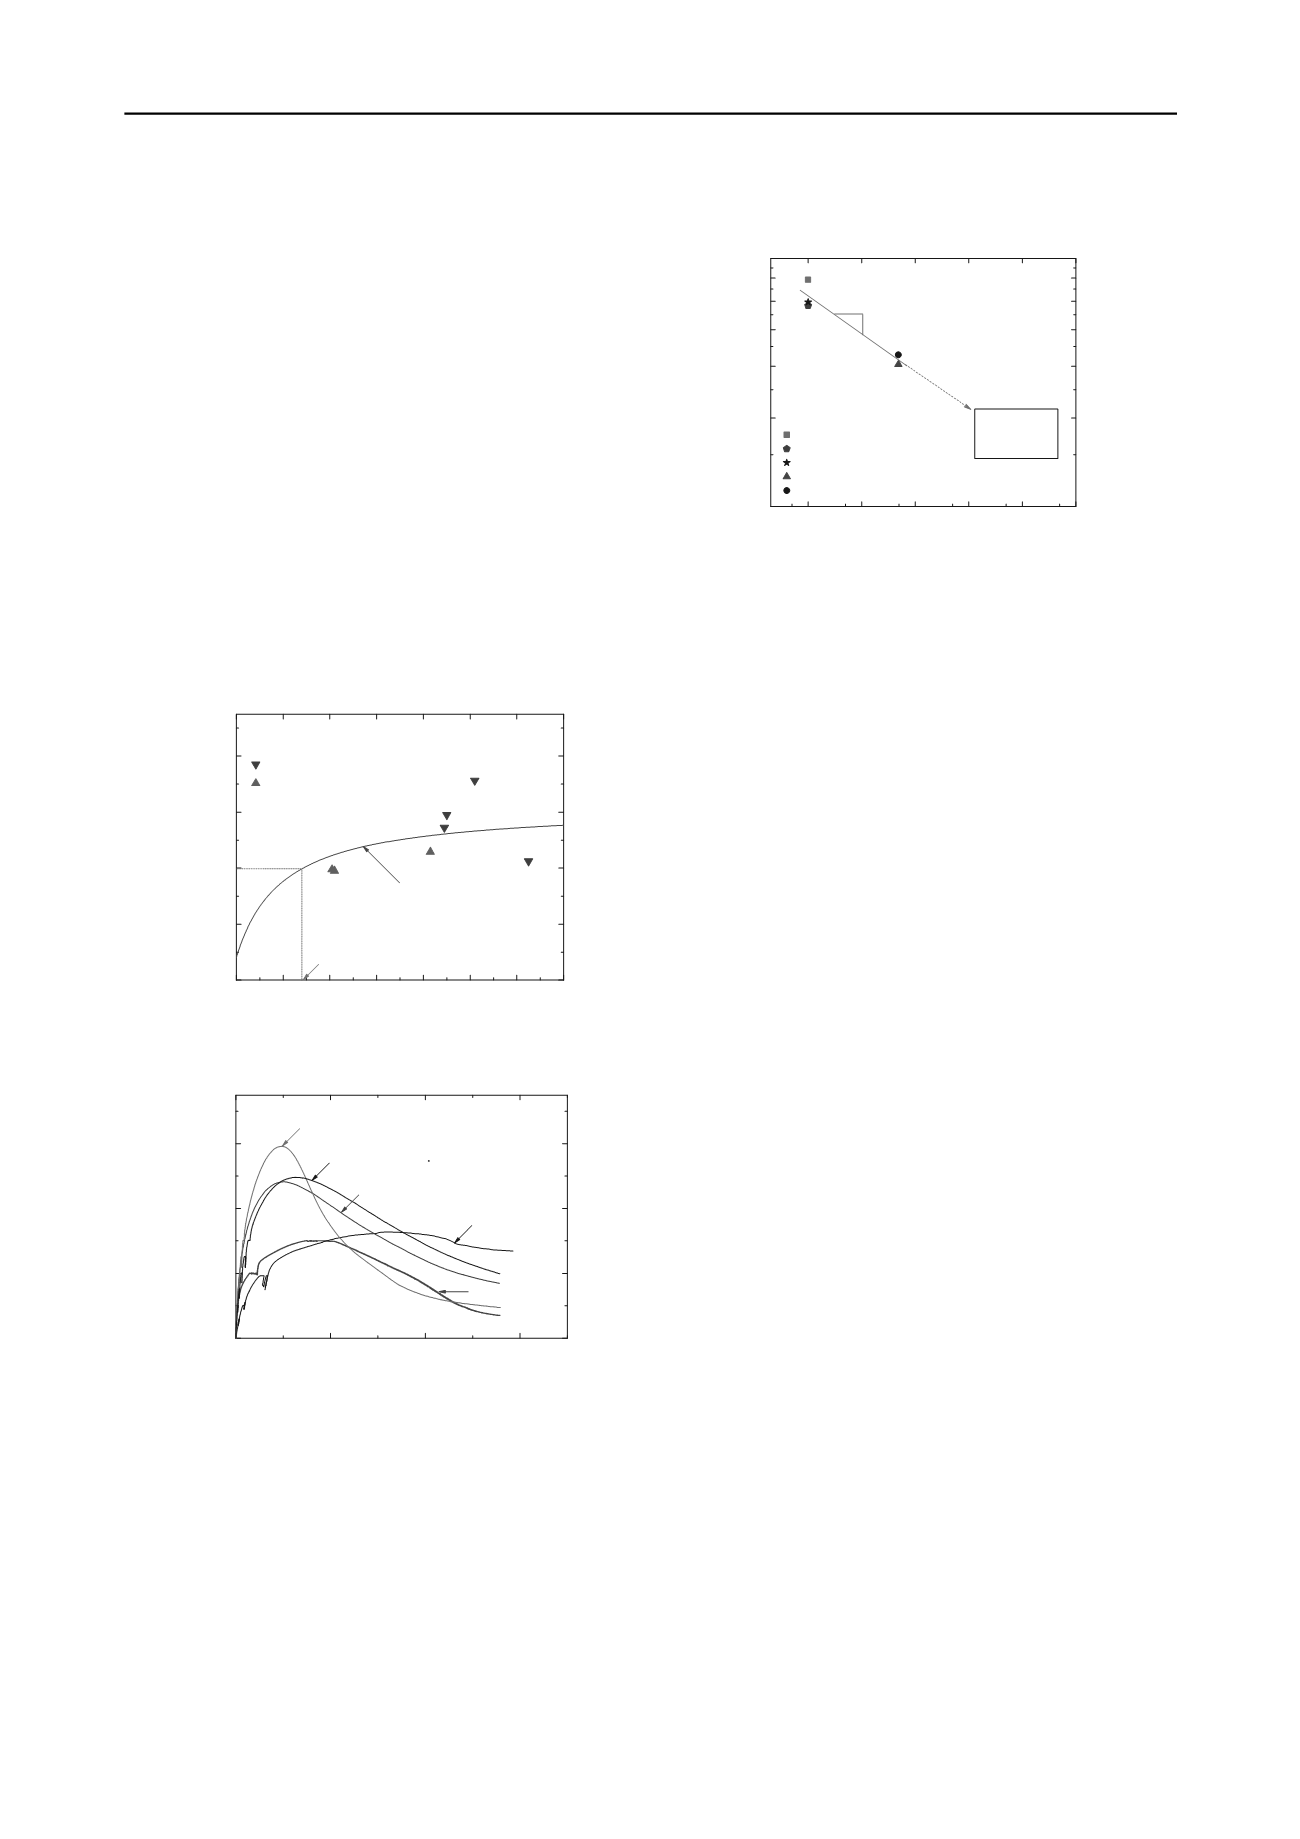
). On the other hand, a well-defined trend exists in the
relationship between
q
max
and the ratio of the specimen volume
to the small specimen volume
V/V
small TC
(Fig. 9): i.e.,
q
max
decreases nearly 40 % with an increase in the specimen volume
by a factor of nearly 50. This fact indicates that Eq. (3) should be
modified to take into account this size effect. More research is
necessary to examine whether this linear relation can be extended
to volumes that exceeds the largest value examined in this study
(such as field full-scale structures).
10
0
10
1
10
2
10
3
10
4
10
5
1.0
2.0
3.0
4.0
5.0
6.0
7.0
1/8
Small TC (PG)
Small TC (CG)
Small TC (SAG)
Large TC (OBG)
Large TC (SAG)
Maximum deviator stress, q
max
(MPa)
Volume ratio,
V/V
SmallTC
Field full-scale
structure
1
Figure 9. Compressive strength
q
max
(
D
c
= 95 % at 4.5Ec);
c/g
= 4.0%; &
t
c
=7 days) plotted against normalized volume by the volume of the small
specimen
V
Small TC
4 CONCLUSIONS
The following conclusions can be derived:
1. High compaction is very effective to obtain high strength of
cement-mixed gravelly soil (CMG).
2. The porosity of the skeleton of gravelly soil only,
n
s
; and the
fraction of the void of soil skeleton occupied by cement,
C
r
, are
two major independent parameters for the strength of CMG. An
empirical equation is proposed to predict the compressive
strength of a given CMG based on a given initial compressive
strength that is a function of
n
s
with an increase with curing time
following a function of
C
r
.
3. Within the limit of test conditions in the present study, for the
same degree of compaction at the respective optimum water
contents with the same cement content, the effects of grading
characteristics on the strength are not significant, while the
effects of specimen volume are significant.
5 ACKNOWLEDGEMENTS
The core samples from Kikonai were provided by the Japan
Railway Construction, Transport and Technology Agency and
the study was financially supported by Japan Society for the
Promotion of Science.
6 REFERENCES
Consoli,
N.C., Foppa, D., Festugato, L. and Heineck, K.S. (2007): “
Key
parameters
for strength control of artificially cemented soils”,
J.
Geotech. Geoenviron. Eng.
, 133(2): 197
–
205.
Ezaoui,. Tatsuoka, F., Sano, Y., Iguchi, Y., Maeda, Y., Sasaki, Y. and
Duttine, A. (2010): Ageing effects on the yielding characteristics of
cement-mixed granular materials, Soils and Foundations, 50(5), 705-
724.
Horpibulsuk, S., Katkan, W., Sirilerdattana, W. and Rachan, R. (2006):
“Strength Development in Cement stabilized low plasticity and Coarse
grained soils: Laboratory and Field Study”,
Soils and Foundation
,
46(3), 351
–
366.
Kongsukprasert, L. and Tatsuoka, F.
(2005): “
Ageing and viscous effects
on the deformation and strength characteristics of cement-mixed
gravely soil in triaxial compression
”
,
Soils and Foundations,
45(6), 55-
74.
Taheri, A., Y. Sasaki, Y., Tatsuoka, F. and Watanabe, K. (2012):
“Strength a
nd deformation characteristics of cemented-mixed gravelly
soil in multiple-
step triaxial compression”,
Soils and Foundations
,
52(1).
Tatsuoka, F., Di Benedetto, H., Kongkitkul, W., Kongsukprasert, L.,
Nishi, T. and Sano, Y. (2008) Modeling of ageing effects on the elasto-
viscoplastic behavior of geomaterial,
Soils and Foundations
, 48(2),
155-174.
Tatsuoka, F., Munoz, H., Kuroda, T., Nishikiori, H., Soma, R., Kiyota,
T., Tateyama, M. and Watanabe, K. (2012): Stability of existing
bridges improved by structural integration and nailing,
Soils and
Foundations
, 52(2).


