330
        
        
          Proceedings of the 18
        
        
          th
        
        
          International Conference on Soil Mechanics and Geotechnical Engineering, Paris 2013


            Proceedings of the 18


            th


            International Conference on Soil Mechanics and Geotechnical Engineering, Paris 2013


          2
        
        
          0,01
        
        
          0,1
        
        
          1
        
        
          10
        
        
          100
        
        
          0
        
        
          20
        
        
          40
        
        
          60
        
        
          80
        
        
          100
        
        
          Cut grading
        
        
          (CG)
        
        
          CG
        
        
          D
        
        
          max
        
        
          = 10 mm
        
        
          D
        
        
          50
        
        
          = 2.92 mm
        
        
          U
        
        
          c
        
        
          = 19.0
        
        
          F
        
        
          c
        
        
          = 9.23 %
        
        
          Parallel grading
        
        
          (PG)
        
        
          PG
        
        
          D
        
        
          max
        
        
          = 10 mm
        
        
          D
        
        
          50
        
        
          = 0.72 mm
        
        
          U
        
        
          c
        
        
          = 50.0
        
        
          F
        
        
          c
        
        
          = 16.5 %
        
        
          OKG
        
        
          D
        
        
          max
        
        
          = 37.5 mm
        
        
          D
        
        
          50
        
        
          = 6.21 mm
        
        
          U
        
        
          c
        
        
          = 44
        
        
          F
        
        
          c
        
        
          = 4 %
        
        
          SCG/SAG
        
        
          D
        
        
          max
        
        
          = 10 mm
        
        
          D
        
        
          50
        
        
          = 2.32 mm
        
        
          U
        
        
          c
        
        
          = 19.0
        
        
          F
        
        
          c
        
        
          = 5.2 %
        
        
          OBG
        
        
          D
        
        
          max
        
        
          = 38.1 mm
        
        
          D
        
        
          50
        
        
          = 2.92 mm
        
        
          U
        
        
          c
        
        
          = 50.0
        
        
          F
        
        
          c
        
        
          = 9.23 %
        
        
          Sieved grading
        
        
          (SCG/SAG)
        
        
          Original crushed
        
        
          sandstone JR (OBG)
        
        
          Percent finer than D by weight
        
        
          Particle size, D (mm)
        
        
          Original crushed
        
        
          sandstone Kikonai (OKG)
        
        
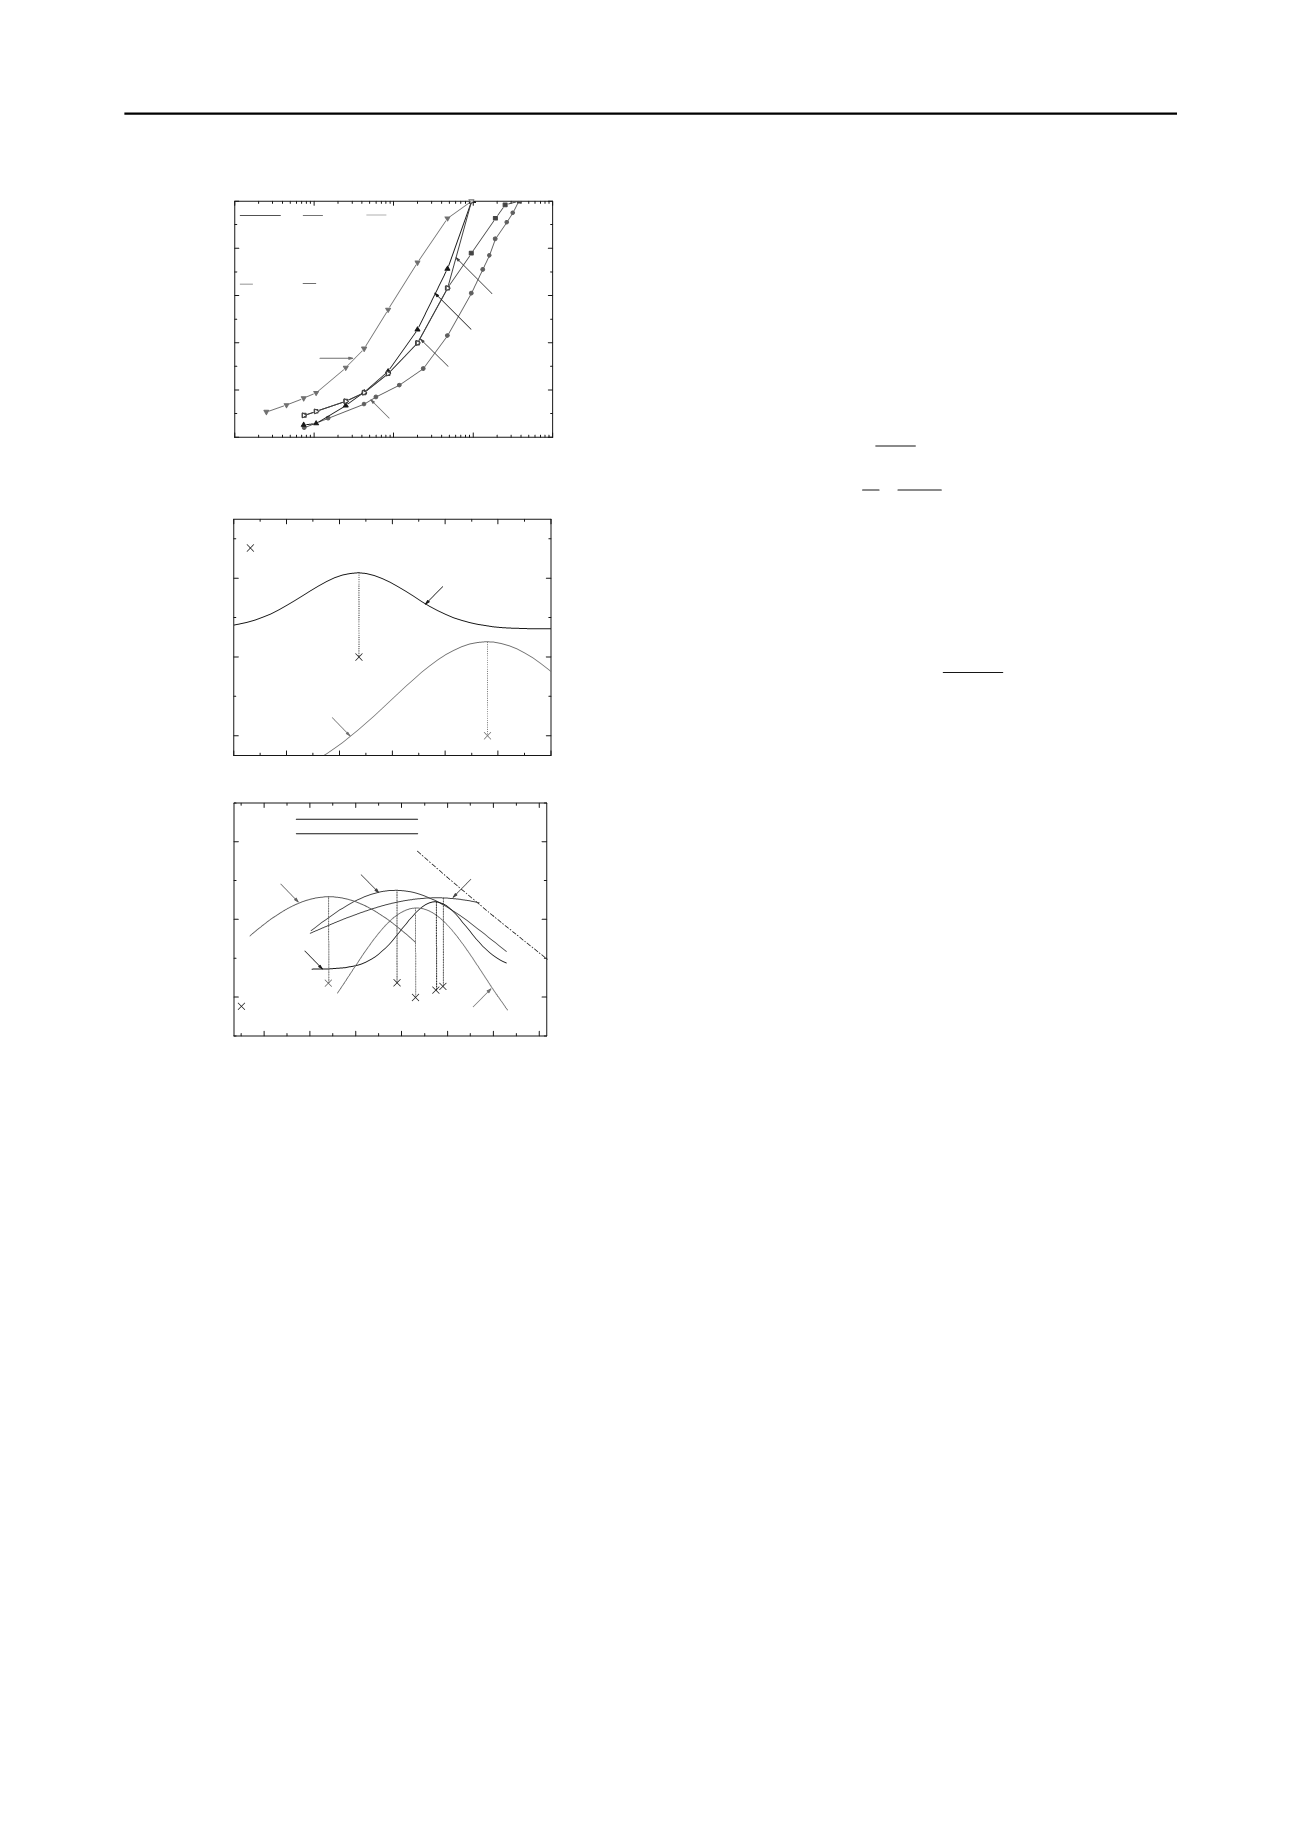
          Figure 1. Grading curves and characteristics of the tested cement-mixed
        
        
          gravels
        
        
          a)
        
        
          5
        
        
          6
        
        
          7
        
        
          8
        
        
          9
        
        
          10
        
        
          11
        
        
          2.0
        
        
          2.1
        
        
          2.2
        
        
          Test conditions (w
        
        
          opt
        
        
          ;D
        
        
          c
        
        
          =95%)
        
        
          1.0 Ec
        
        
          c/g=2.5%
        
        
          4.5 Ec
        
        
          c/g=4/0%
        
        
          Dry density,


          d
        
        
          (g/cm
        
        
          3
        
        
          )
        
        
          Sieved Chiba gravel (SCG)
        
        
          water content, w (%)
        
        
          b)
        
        
          4
        
        
          5
        
        
          6
        
        
          7
        
        
          8
        
        
          9 10
        
        
          2.1
        
        
          2.2
        
        
          2.3
        
        
          Modified Proctor (4.5E
        
        
          c
        
        
          )
        
        
          Test conditions (w
        
        
          opt
        
        
          ;D
        
        
          c
        
        
          =95%)
        
        
          7.9 5.4 6.9 7.3 7.75
        
        
          w
        
        
          opt
        
        
          (%):
        
        
          p
        
        
          d_max
        
        
          (
        
        
          g/cm
        
        
          3
        
        
          )
        
        
          :
        
        
          water content, w (%)
        
        
          Dry density,


          d
        
        
          (g/cm
        
        
          3
        
        
          )
        
        
          OBG
        
        
          PG
        
        
          CG
        
        
          OBG OKG CG PG SAG
        
        
          2.22 2.23 2.23 2.21 2.22
        
        
          SAG
        
        
          OKG
        
        
          Figure. 2. Compaction curves: a) SCG for 1.0Ec & 4.5 E
        
        
          c
        
        
          and c/g= 2.5%
        
        
          & 4/0 %; and b) five cement-mixed gravelly soils presented in Fig. 1 for
        
        
          4.5Ec and c/g= 4.0% (except for PG and OKG)
        
        
          Fig. 3 presents the development of the compressive strength


            q


            max


          at confining pressure of 20 kPa with the period of initial curing
        
        
          under the atmospheric pressure at a constant water content (the
        
        
          same as prepared) of four kinds of SCG specimen prepared under
        
        
          different conditions (1.0E
        
        
          c
        
        
          or 4.5E
        
        
          c
        
        
          and


            c/g


          =2.5 or 4.0 %). The
        
        
          following trends can be noted. Firstly, the


            q


            max


          value increases
        
        
          considerably with time, which should be due to the cement
        
        
          hydration process. The increase until a curing period of 14 days
        
        
          is rather proportional to the “initial” value at 7 days.
        
        
          Secondly,
        
        
          the


            q


            max


          value is largely different among the four kinds of
        
        
          specimen (up to a factor of 100 %). Thirdly, the effects of
        
        
          compacted dry density
        
        
          ρ


            d


          on the


            q


            max


          value when


            c/g


          = 2.5 % are
        
        
          significant. An increase more than 100 % results from an
        
        
          increase in
        
        
          ρ


            d


          of only about 5 % associated with an increase in
        
        
          the compaction level from 1E
        
        
          c
        
        
          to 4.5E
        
        
          c
        
        
          . On the other hand, when
        
        
          the compaction level is 1.0E
        
        
          c
        
        
          , the


            q


            max


          value increases by a factor
        
        
          of only about 40 % with an increase in


            c/g


          from 2.5 % to 4. 0%
        
        
          (i.e., an increase of about 60 %).


            E


            c


          and


            c/g


          are the parameters commonly used in practice,
        
        
          because they are easily measured and controlled. However, they
        
        
          are not the basic parameters that control the strength and
        
        
          deformation characteristics of CMG. This feature can be easily
        
        
          seen from the following inherent drawbacks (Watanabe et al.
        
        
          2003, Kongsukprasert et al. 2005). Firstly, with materials having
        
        
          different specific density


            s


          , for the same c/g value and the same
        
        
          soil void ratio, the volume of cement per volume increases with
        
        
          an increase in


            s


          , despite that


            s


          has no direct effect on the stress-
        
        
          strain properties. Secondly, the effect of compaction level for the
        
        
          same


            c/g


          value (and same


            s


          ) has two components: 1) a better
        
        
          interlocking among soil particles with a decrease in the soil void
        
        
          ratio; and 2) a larger amount of cement in a less volume of the
        
        
          total void of soil particle skeleton. Based on this consideration,
        
        
          two independent parameters are postulated: the soil skeleton
        
        
          porosity


            n


            s


          (representing the structure of the skeleton of gravelly
        
        
          soil particles only); and the cement void ratio


            C


            r


          (representing
        
        
          the fraction of the void of the soil skeleton occupied by cement):


            s


            s


            V V n


            V


          (1)


            c


            c


            r


            v


            s


            V V


            C


            V V V


          (2)
        
        
          where


            V


          is the total volume;


            V


            s


          is the volume of gravelly soil
        
        
          particles;


            V


            v


          is the volume of the void of the skeleton of gravelly
        
        
          soil ; and


            V


            c


          is the volume of cement.
        
        
          Ezaoui et al. (2011) also proposed the following hyperbolic
        
        
          function for the


            q


          max
        
        
          value that increases with time and is a
        
        
          function of these two parameters independently:


          max
        
        
          0
        
        
          .
        
        
          1


            r c


            c


            s


            c


            a C t


            q t


            q n


            b t


          (3)
        
        
          where


            t


          c
        
        
          is the curing period;


            q


            0


          is the initial compressive
        
        
          strength (when


            t


          c
        
        
          = 0) that decreases with


            n


            s


          ;


            a


          is the parameter
        
        
          showing the cementation effect that increases with


            C


            r


          ; and


            b


          is
        
        
          the constant parameter that depends on cement type. The
        
        
          functions


            a


          (


            C


          r
        
        
          ) and


            q


          0
        
        
          (


            n


          s
        
        
          ) are obtained based on the data
        
        
          presented in Fig. 3 together with those from CD TC tests on
        
        
          rotary core samples retrieved from the field, as shown below.
        
        
          Three solid lines presented in Fig. 4 denote the iso-strength lines
        
        
          for constant


            q


            max


          =


            q


            1


          ,


            q


            2


          and


            q


            3


          at a specified


            t


            c


          according to Eq.
        
        
          (3) with known values of


            q


          0
        
        
          ,


            a


          and


            b


          . The dash-dot curves are the
        
        
          corresponding


            c/g


          = constant curves. From such a plot as shown
        
        
          in Fig. 4, the most suitable (i.e., the most cost-effective)
        
        
          combination of (


            C


            r


          ;


            n


            s


          ) of a given type of CMG that achieves a
        
        
          given required compressive strength can be chosen referring to
        
        
          the cost for cement and compaction work.
        
        
          2.2


            U tests on specimens made using a material use


            in the field


          The use of CMG is now spreading in Japan, particularly to
        
        
          construct bridge abutments for high speed train lines. Very
        
        
          recently, a geosynthetic-reinforced soil (GRS) integral bridge
        
        
          was constructed. The backfill immediately behind the facing is
        
        
          well-compacted cement-mixed gravelly soil. The grading curve
        
        
          of this backfill material (i.e., crushed gravel from a quarry,
        
        
          denoted as the Original Kikonai Gravel, OKG) is presented in
        
        
          Fig. 1. The compaction curve for 4.5E
        
        
          c
        
        
          is presented in Fig. 2b.
        
        
          Before the construction, to determine the cement-mixing
        
        
          proportion, a series of U tests were performed on specimens
        
        
          mixed at c/g = 2.0, 4.0 and 6.0 %, compacted to


            D


            c


            =


          95 % at


            w=


            w


            opt


          (4.5E
        
        
          c
        
        
          ) and cured for 7 and 28 days. To accommodate the
        
        
          maximum particle size of 37.5 mm, large specimens (150 mm in
        
        
          diameter and 300 mm in height) have been used.
        
        
          To apply Eq. (3) to the data from these U tests,


            b


          =19.62 was
        
        
          used, which was obtained by analyzing a data set from a series of
        
        
          CD TC tests on cement-mixed SCG cured for a period of 1 ~ 180
        
        
          days (Ezaoui et al., 2010, 2011). The values of


            a


          (


            C


          r
        
        
          ) and


            q


          0
        
        
          (


            n


          s
        
        
          )
        
        
          for the three


            c/g


          values and the two curing periods were
        
        
          determined from the reported values of


            q


          max
        
        
          (


            t


          c
        
        
          ). They are plotted
        
        
          against their corresponding


            n


            s


          and


            C


            r


          values in Figs. 6a and b
        
        
          (round symbols). In so doing, to eliminate possible effects of
        
        
          specimen size and grading characteristics (discussed in the next
        
        
          section), these


            q


          max
        
        
          values had been corrected to become the
        
        
          same values as those obtained for the smaller specimen (i.e., the
        
        
          data presented in Fig. 3) under the same test conditions (i.e., a
        
        
          curing period of 7 days;


            D


            c


          = 95 %; and


            c/g


          = 4.0 %). Then, in
        
        
          Figs. 6a and b, only relative variations of


            q


            0


          and the parameter


            a


          due to variations in the


            n


          s
        
        
          and


            C


            r


          values among those U test