331
Technical Committee 101 - Session II /
Comité technique 101 - Session II
Proceedings of the 18
th
International Conference on Soil Mechanics and Geotechnical Engineering, Paris 2013
3
specimens are highlighted. In these figures, the data points of
SCG (square symbols) obtained from the data presented in Fig. 3
are also presented. It may be seen that these two sets of data,
which are for the specimens compacted to the same
D
c
(i.e., 95
%) at the respective optimum water contents, are consistent with
each other. Linear functions can be fitted to the
q
0
-
n
s
and
a
- C
r
relations with a small variance less than 10 %.
6
8
10
12
14
0.0
2.0
4.0
6.0
8.0
Cement mixed Chiba gravel (SG) -
h
'=20kPa
Maximum deviator stress, q
max
(MPa)
Time, t
c
(days)
1Ec / 2.5%
1Ec / 4.0%
4.5Ec / 2.5%
4.5Ec / 4.0%
*
Figure 3. Development of compressive strength
q
max
with time
t
c
for
different cement contents
c/g
and different compaction energy levels
E
c
(laboratory specimen of Sieved Chiba Gravel, SCG)
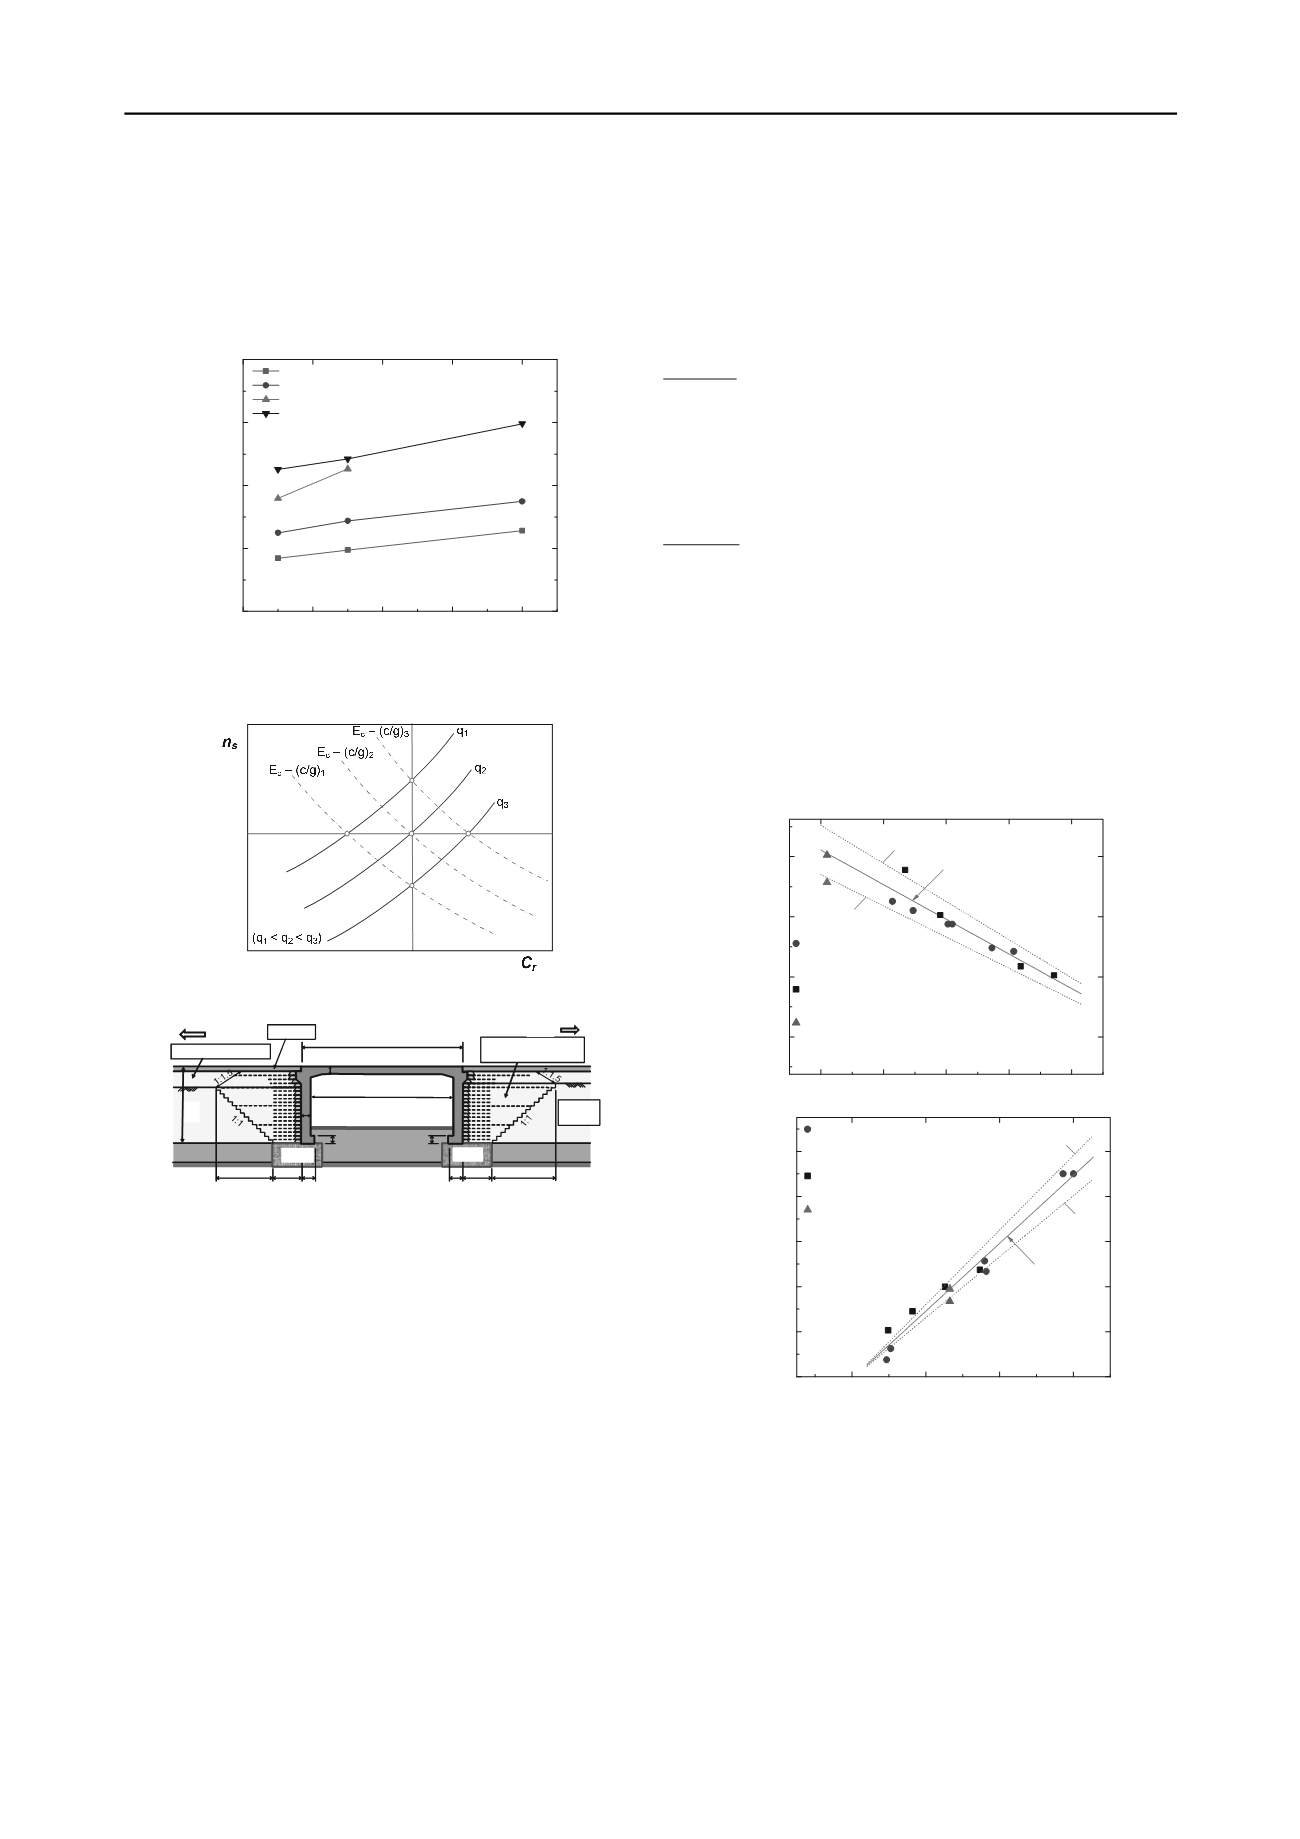
Figure 4. Illustration of the effect of skeleton porosity
n
s
and cement void
ratio
C
r
on the compressive strength
q
max
=q
1,2,3
GCM: Ground improvementby cement-mixing
4.2
2.2
1.0
4.5
2.2
1.0
0.7
0.7
[Allunits in m]
GCM
Road surface
12.0
GCM
GL= 5.0
Original
ground
Backfill(uncemented)
Backfill(cement-mixed
gravelly soil)
6.1
10.75
East
West
RC slab
0.6
0.6
Figure 5. General structure (the width= 11.7 m) of the first prototype
GRS integral bridge, for the new bullet train line at Kikonai, the south
end of Hokkaido (by the courtesy of the Japan Railway Construction and
Technology Agency), constructed in 2011 (Tatsuoka et al., 2012)
2.3
TC tests on core samples retrieved from the field
It is examined below whether the empirical relations shown in
Figs. 6a and b can be applied to the data from CD TC tests on
rotary core samples retrieved from the CMG backfill of the GRS
integral bridge (Fig. 5). The backfill was compacted to
D
c
= 100
% (4.5Ec), higher than the laboratory-prepared specimens
analyzed above, and at
c/g
= 3.0 %. The core samples were 80
mm in diameter and 160 mm or less in height. The
q
max
values
evaluated by CD TC tests at confining pressure of 20 kPa are
plotted against
t
c
(from the time of compaction in the field until
respective TC tests) in Fig. 7. The data exhibit a large scatter,
which is inevitable with such core samples from the field (e.g.,
Taheri et al., 2012). Yet, the trend that
q
max
increases with
t
c
is
obvious. It may also be seen that, even at a relatively low
c/g
(=
3.0 %), the strength tends to exceed 10 MPa after
t
c
= three
months, which is a nearly half of the strength of ordinary
concrete. This property should be due to very high compaction
(i.e.,
D
c
= 100 % (4.5Ec) with
ρ
d
~ 2.23 g/cm
3
) achieved by field
compaction. It is to be noted that very high stiffness values were
measured with the two core samples cured for about 90 days
presented in Fig. 7. That is, the small-strain Young modulus (at
the isotropic stress-state) was about 35 GPa, which is the same
order of magnitude as ordinary concrete. With these core
specimens,
n
s
= 20.2 % and
C
r
= 9.3 % were obtained from
d
=
2.23 g/cm
3
and
c/g
= 3.0 %. Based on the respective linear
relations presented in Figs. 6a and b, the parameters
q
0
and
a
for
Eq. (3) were evaluated by two methods:
Method 1): By substituting
n
s
= 20.2 % into the linear relation in
Fig. 6a,
q
0
= 1.61 MPa is obtained (i.e., a data point of triangular
symbol 1), located on the linear relation). Then, by assuming the
same coefficient
b
=19.62 as the laboratory-prepared specimens
for Eq. (3) and using this
q
0
value, an average relation is best-
fitted to the data presented in Fig. 7. Then,
a
= 6.7 % is obtained
for
C
r
= 9.3 % (i.e., a data point of triangular symbol 1) in Fig.
6b).
Method 2): By substituting
C
r
= 9.3 % into the linear relation
shown in Fig. 6b,
a
= 7.7 % is obtained (i.e., a data point of
triangle symbol 2), located on the linear relation). Then, by
assuming
b
= 19.62 as above for Eq. (3) and using this
a
value, an
average relation is best-fitted to the data presented in Fig. 7
(which is eventually the same as the one obtained by Method 1)).
Then,
q
0
= 1.43 MPa is obtained for
n
s
=20.2 % (i.e., a data point
of triangular symbol 2) in Fig. 6a).
As seen from Figs. 6a and b, the results obtained by two methods
are consistent. The results shown above indicate that Eq. (3) is
relevant for various kinds of CMGs with different grading
characteristics, different cement contents (c/g= 2.0 ~ 6.0 %) and
a relatively wide range of compaction level (
d
= 2.0 ~
2.23 g/cm
3
).
a)
0.20 0.22 0.24 0.26 0.28
0.4
0.8
1.2
1.6
2)
-10%
OKG (Kikonai) - 4.5E
c
(D
c
=95%)
(c/g=2.0, 4.0 and 6.0%)
Specimen prepared in the laboratory
SCG - 1.0/4.5Ec (D
c
=95%)
(c/g=2.5 and 4.0%)
OKG (Kikonai) - 4.5E
c
(D
c
=100%)
(c/g=3.0%)
Two deduced data 1) & 2)
from TC tests on rotary core samples from the site
Parameter q
0
(MPa)
Porosity of squeleton, n
s
(%)
Linear fitting
+10%
1)
b)
4
8
12
16
0
4
8
12
16
20
+10%
OKG (Kikonai) - 4.5E
c
(D
c
=95%)
(c/g=2.0, 4.0 and 6.0%)
(specimen prepared in the laboratory)
SG (Chiba) 1.0/4.5Ec (D
c
=95%)
(c/g=2.5 and 4.0%)
OKG (Kikonai) - 4.5E
c
(D
c
=100%)
(c/g=3.0%)
Two deduced data 1) & 2)
from TC tests on rotary core
samples from the site
Parameter a(C
r
)
Cement void ratio, Cr (%)
Linear fitting
-10%
1)
2)
Figure 6. a) Variation of parameter
q
0
, Eq. (1), with skeleton porosity
n
s
and; b) variation of parameter
C
r
, Eq. (1) with cement void ratio
C
r
3 EFFECTS OF SPECIMEN AND PARTICLE SIZES
The compressive strength at given confining pressure is also
controlled by factors other than those analyzed in the section
above, including: grading characteristics, such as the mean
diameter
d
50
and the uniformity coefficient, fines content etc.
(factor G); and the size of specimen (factor S) (Ezaoui et al.,
2011). Two relevant parameters, among others, for factor S are:
i) the particle/specimen size ratio (represented by the ratio of the
specimen diameter
D
to
d
50
); and; ii) the specimen volume
V
.


