339
Technical Committee 101 - Session II /
Comité technique 101 - Session II
Proceedings of the 18
th
International Conference on Soil Mechanics and Geotechnical Engineering, Paris 2013
4.2
Ice lens formation in open-system freezing
Figure 4 shows the different ice lens formation in open system
freezing for selected materials. The biggest ice lenses develop in
the transition zone between frozen and unfrozen areas in the
thermal steady state.
a)
b)
c)
d)
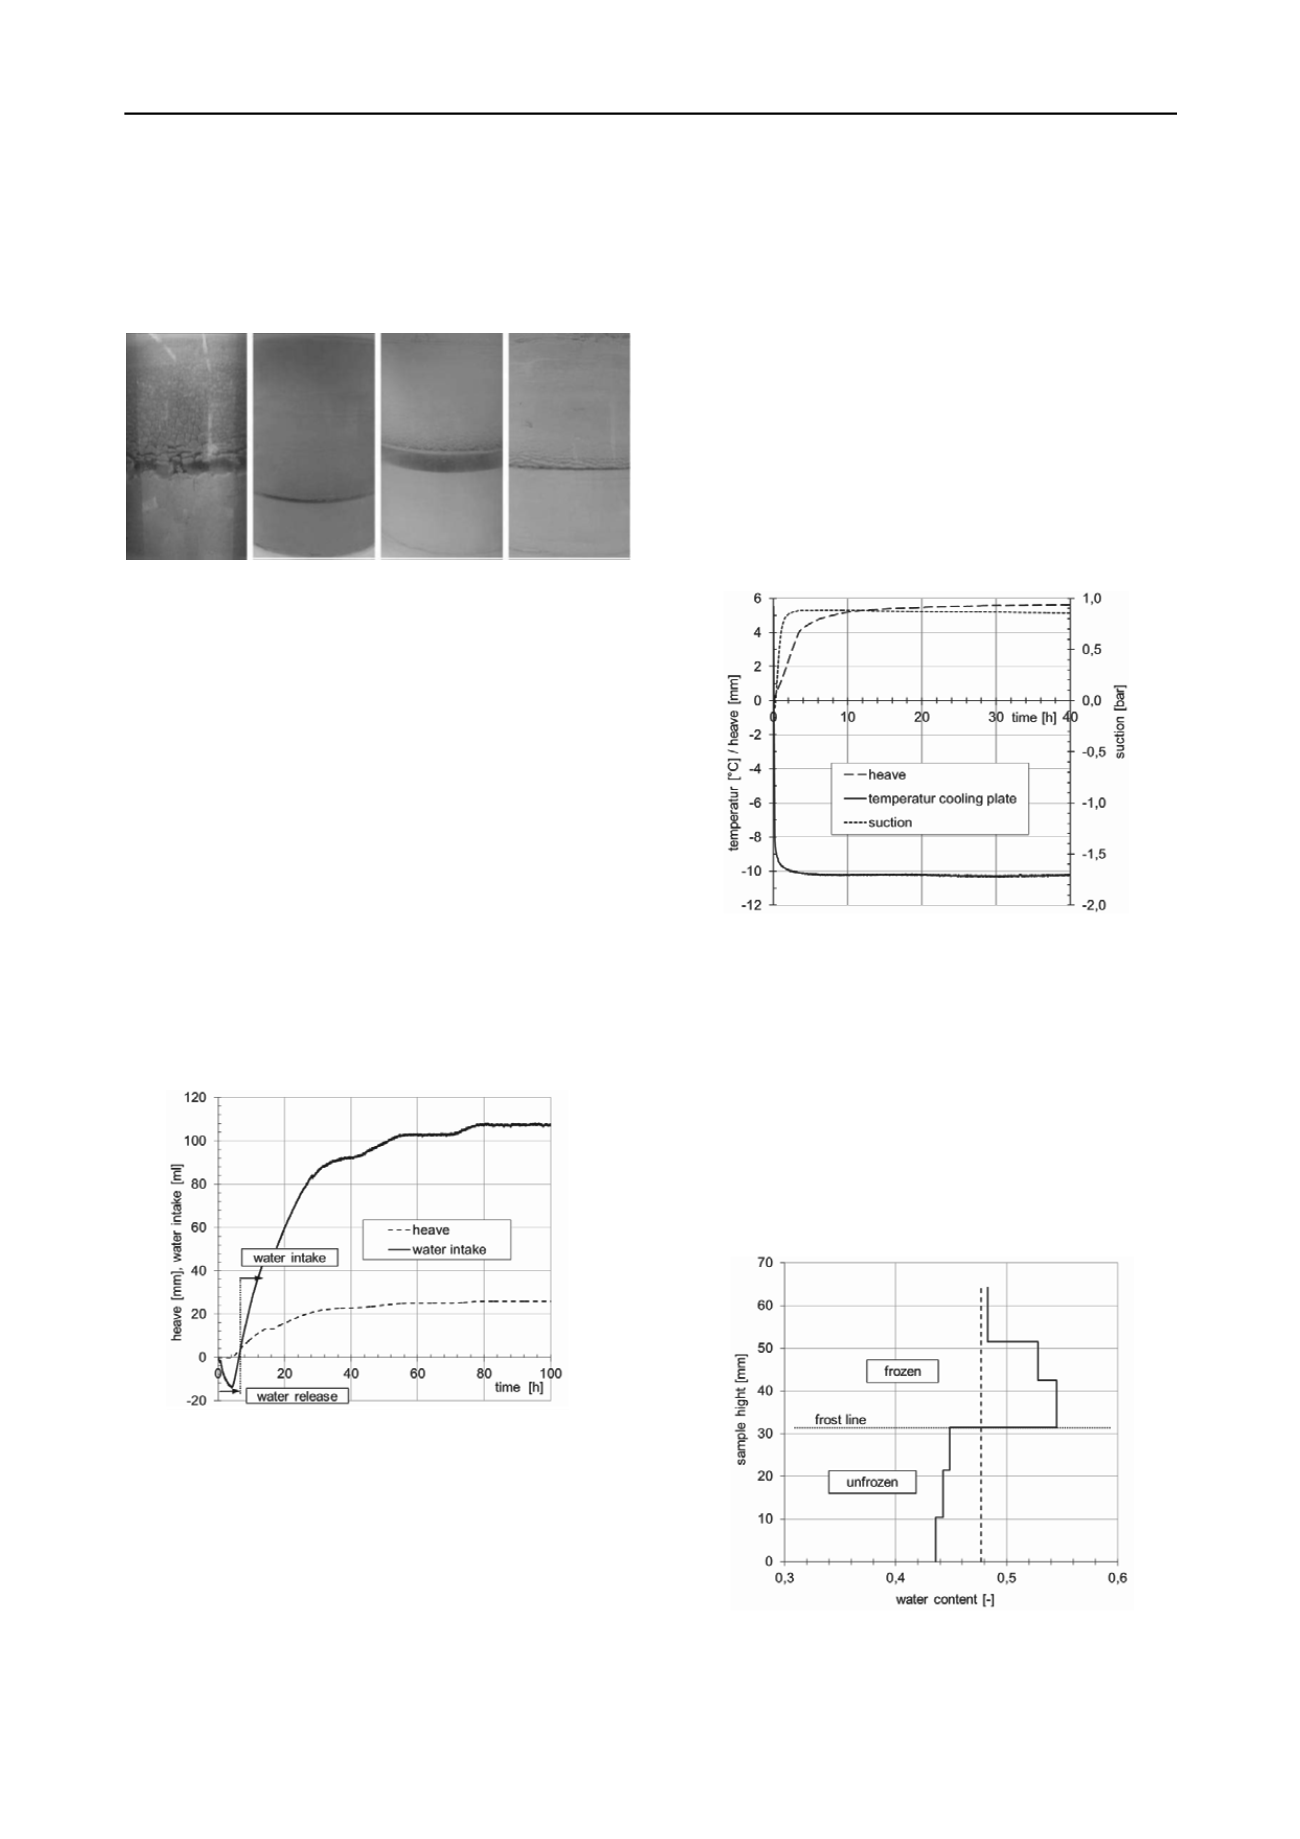
Figure 4. Specimens at the end of open system freezing tests: a) TS (100
kN/m²), b) S (20 kN/m²), c) K (20 kN/m²), d) K (100 kN/m²)
Under the chosen test conditions, the greatest changes can be
observed for the bentonite (a) due to its intense capacity to draw
water to the frost line and also due to the initially high water
content. Water migrates from the storage vessel into the
specimen as a result of frost penetration. Furthermore, the
existing water in the specimen is reallocated initially resulting
in fine distributed ice lenses (dark areas) and with a slowing
frost penetration in a development of bigger ice lenses. In
contrast, the Kaolin (c) tests show only little structural changes.
In the upper part only little water enrichment is noticeable and it
is smoother distributed throughout the height. Comparing the
results for silt (b) and kaolin (c) with a surcharge of 20 kN/m² it
is apparent that the final ice lens can grow thicker for kaolin
than for silt. The comparison of ice lens formation in kaolin
with a surcharge of 20 kN/m² (c) and 100 kN/m² (d) clearly
shows that a higher surcharge is restricting the formation. In
tests with quartz powder and fine sand no water migration into
the specimen was observed. Tests with limestone powder have
shown little water intake and reallocation but it is too less to be
visible on the picture.
Figure 5. Changes in water content in the specimen and displacement
with time for kaolin (20 kN/m²)
Correlating with the development of ice lenses are the
changes of water content in the specimen and the displacement
(heaves). Figure 5 shows the results of a test with kaolin with a
surcharge of 20 kN/m². Initially, water is expelled until it is
water drawn in the specimen and a noticeable heave builds up.
This effect was also observed in investigations of Konrad and
Morgenstern (Konrad and Morgenstern 1982). In the course of
the experiment, the kaolin specimen absorbed approximately
122 ml of water. In contrast, the water content for a limestone
powder specimen under the same test conditions is at the end
lower than at the beginning of the test. This is due to the fact
that the absorbed amount of water is not compensating for the
water that was initially expelled.
4.3
Processes in open-system freezing
The test series aims at investigating the suction as principle for
the water flow and the development of ice lenses. For a test with
kaolin, Figure 6 shows the development of suction and heave in
the course of frost penetration. Simultaneously with the
beginning of the freezing process and movement of the frost
line into the specimen suction, builds up. Its maximum of 0.88
bar is already reached after approximately 8.5 hrs. The thermal
steady state is reached after 16 hrs. The course of the heave
follows the temperatures. The initially fast frost penetration is
reflected in a strong increase of heave. With the slowing of frost
penetration the heave curve flattens. After the thermal steady
state has been reached the further increase of the heave is only
marginal.
Figure 6. Development of suction and heave for kaolin due to drop of
temperature of the cooling plate (surcharge 20 kN/m², overconsolidated,
closed system)
Even in closed-system freezing reallocation processes
emerge within the specimen due to the suction that develops at
the frost line. Under the assumption that water is incompressible
and no air is in the system, the water can technically not flow
towards the frost front. If the adjacent unfrozen soil could be
consolidated further under the influence of suction, it is possible
that water can be drawn to the frost line from these unfrozen
areas. The amount of water transported in this way is limited by
the predefined water content of the specimen and therefore not
necessarily visible. However, sawing the specimen allows
determination of the water content distribution over the
specimen.
Figure 7. Water content distribution for a test with kaolin with an
applied surcharge of 300 kN/m² (closed system)
Figure 7 shows the water distribution for a test with kaolin
(300 kN/m²). Shown as the dashed vertical line is the initial


