334
Proceedings of the 18
th
International Conference on Soil Mechanics and Geotechnical Engineering, Paris 2013
Proceedings of the 18
th
International Conference on Soil Mechanics and Geotechnical Engineering, Paris 2013
upon a given assumed materials properties, such as the
brittleness ratio,
q
u
/
q
t
, = 10,
= 30
o
, and b/H = 1 were
suggested for practical use (Fang and Fernandez, 1981).
However, they may not be suitable for other material setting. In
this study, we carried out unconfined compression tests and
direct shear tests to acquire information on
q
u
and
.
Afterwards, from our indentation test results, we can iteratively
compute both values of the
K
and the tensile strength
q
t
.
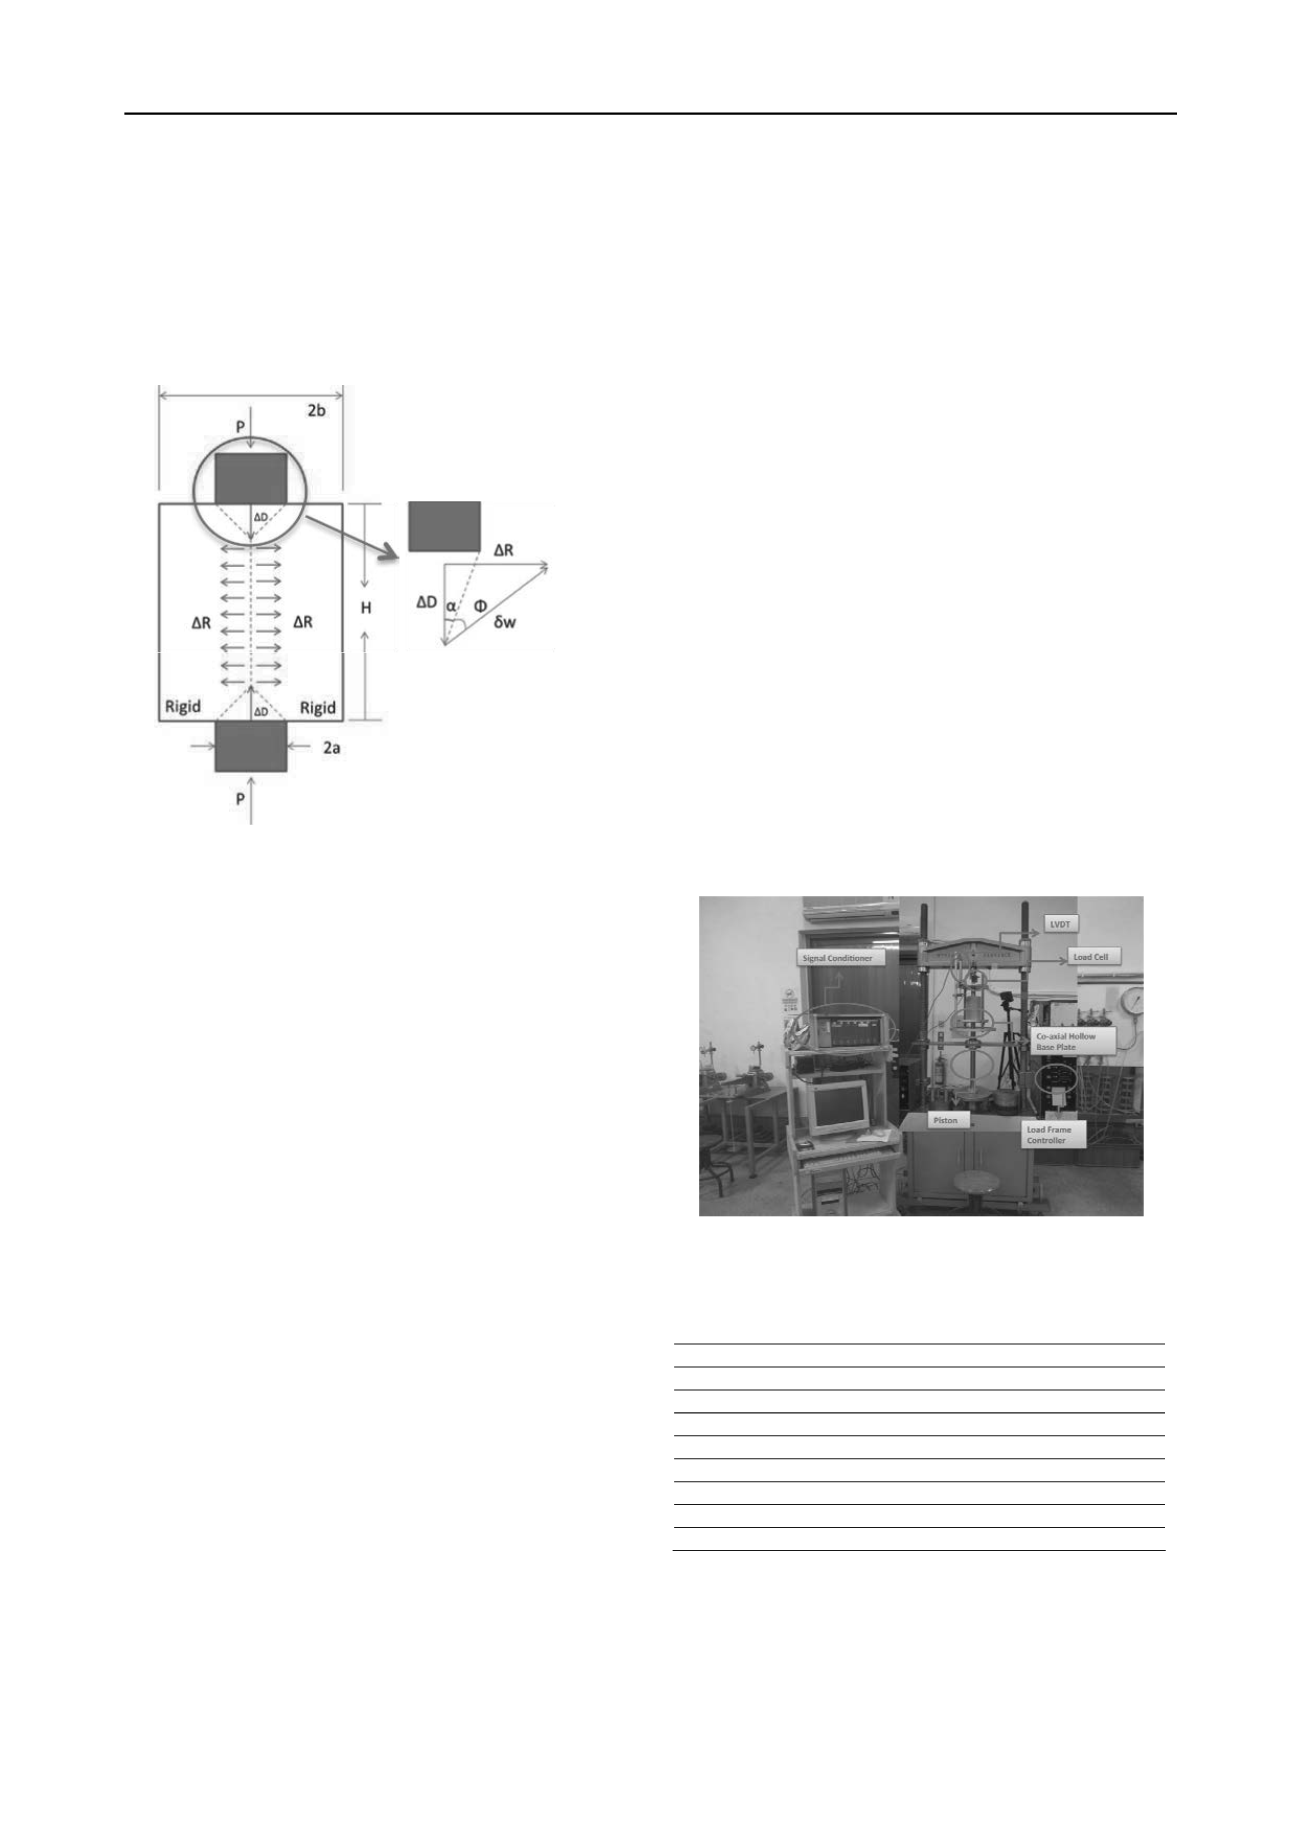
Figure 1. Limit analysis of indentation test
3 TESTING PROGRAM
To assess the theoretical framework for indentation test
described above, nine different test configurations were
presented in this paper. The diameter of each specimen, 2b, was
kept as 100 mm. The height of each specimen, H, was chosen as
50, 100, and 150 mm respectively. The ratio of the indenter
diameter to specimen diameter, 2a/2b, was selected as 0.225,
0.281, and 0.338 respectively. Replication for one test
configuration indicated that the results of the indentation tests
are repeatable within 5% variation. Therefore, only the results
for each test configuration were shown here.
The specimens were compacted silica sand-Kaolinite
mixture. As we would like to have a lightly cemented sandy
specimen, which is brittle enough for the indentation tests, the
combination of 15% dry weight of Kaolinite plus 85% dry
weight of sand were selected after several trials. The water was
then added to reach moisture content of 8.1% followed by
sealing the soil mixture in a bag resting for 24 hours. After
compaction, the dry density was about 1.62 g/cm
3
. The
specimen was mounted in the testing apparatus shown in Figure
2. An indentation rate of 0.5 mm/min was applied to each test.
The indenter penetration and the corresponding compressive
load were recorded for data reduction. An unconfined
compression test on a specimen with 100 mm in diameter and
200 mm in height was conducted as well as direct shear tests
under normal stress of 40, 80, and 160 kPa.
4 RESULTS AND DISCUSSION
Figures 3-5 show the load-displacement curves for specimen
height 50 mm, 100 mm and 150 mm respectively. In each
figure, three curves represent the results of different sizes of
indenter. All nine curves show softening after peak load,
indicating split tension failure mode occurred. Before
computing the tensile strength, unconfined compression tests
were conducted with a specimen height-to-diameter ratio 2
followed the ASTM standards. The
q
u
was found to be around
16336.5 N/m
2
. A internal frictional angle
= 30.8
o
was
determined through a series of direct shear tests.
With the information of peak axial force
p
,
q
u
, and
, tensile
strength,
q
t
and the corresponding
K
value can be determined
through the iterations using equations 3 and 5. Table 1 shows
the iterated
q
t
and
K
associated with each test configuration.
From the test results show in Table 1, it is recognized that the
tensile strength of the lightly cemented sand is specimen size
dependent. For a given specimen height, the higher the indenter-
to-specimen diameter ratio, a/b, the smaller the tensile strength
is. The developed cone angle
is also found specimen and
indenter size dependent. For a given specimen height, the
angle is in proportional to indenter size. For a given indenter
size, higher specimen had smaller developed angle
. The
coefficient
K
is also found dependent on test configuration. The
trend for
K
to specimen height and indenter size is similar to the
trend for the
angle. The computed
K
values fall between 1.5
and 3.5 depending on test configuration as displayed in Figure
6. This is not consistent with the recommended values, where
1.0 to 1.2 for soil was presented in Fang and Chen (1972). The
major difference between Fang and Chen’s work and the current
study lies in the brittleness ratio,
q
u
/
q
t
. In Fang and Cheng’s
pioneer work, the brittleness ratio was assumed to be 10 for
compacted soil. In the current study, the brittleness ratio was
determined to be around 16 to 20, as shown in Figure 7.
Looking back on equation 5, the tensile strength is dependent on
K
value, which is dependent on the developed cone angle
.
Also, the angle
is a function of brittleness ratio as shown in
equation 3. As a result, using an iterated value for
K
seems
more attractive as the brittleness for soil could have a wide
range.
Figure 2. Indentation tensile strength testing apparatus
Table 1. Summary of test results
H
(mm)
2
a
/2
b
(
o
)
p
(N)
K
q
t
(N/m
2
)
50
0.225
15.9
15.7
1.93
1061.1
50
0.281
18.9
18.6
2.55
955.3
50
0.338
21.4
22.1
3.42
849.1
100
0.225
12.6
23.5
1.49
1020.2
100
0.281
14.9
27.7
1.77
1013.2
100
0.338
18.1
29.7
2.36
819.9
150
0.225
11.1
29.5
1.33
951.8
150
0.281
13.1
34.5
1.55
961.0
150
0.338
15.7
37.6
1.90
853.8


