326
Proceedings of the 18
th
International Conference on Soil Mechanics and Geotechnical Engineering, Paris 2013
Proceedings of the 18
th
International Conference on Soil Mechanics and Geotechnical Engineering, Paris 2013
2 micrometers account for about 60%. The value of specific
gravity of solid particles is 2.6. Diatomite is mainly silt sized;
its silt sized particle account for more than 88% while clay size
particles are about 3%.
3.2 Preparation of sample mixtures
Dry kaolinite powder and dry diatomite were thoroughly
mixed in required proportion by weight. The homogenized
mixtures were placed in the bowl of a blender and the necessary
distilled water was added so that the mixture had the water
content corresponding to its liquid limit. There was no any
particle segregation when two different materials were mixed.
The wet mixture was placed by spooning, in a cylindrical mold
of 12.9 cm in diameter and 16 cm in height. The cylindrical
mold served as consolidation cell, for that, two porous stones
were introduced, one in the superior part and the other in the
inferior one, both protected with filter paper, to avoid occluding
the porous stones. The cylindrical mold with the mixture was
placed in a consolidometer frame and a vertical stress of 130
kPa was applied during 28 days. Once the time of consolidation
has elapsed, we extracted the soil sample, using a wire between
separate the mold from the soil.
3.3 Index Tests
ASTM standards were followed in determining index
properties, summarized in Table 1.
Atterberg limits increase with the increase in diatomite
content, however, I
P
decreased. Activity (i.e., the ratio between
the plasticity index and clay size particles percentages) of the
diatomite-kaolin mixtures increased with the increase in
diatomite content (Table 1), this apparent increase is quite
contradictory to the conventional perception, as mentioned by
Shiwakoti et al. (2002). This fact suggests that the diatoms do
not behave as silt size inert particles; on the contrary, they
behave as very active clay particles.
Table 1. Index properties and physical properties of soil mixtures
4. COMPRESSIBILITY OF SOIL MIXTURES
ASTM standards were followed in determining compressibility
properties of the soil mixtures, and strain data are given in
Table 2.
Table 2 Results of compression tests on diatomite-kaolin mixtures
A series of six tests was carried out on 63.3 mm diameter
and 25.4 mm high specimens through the incremental load (IL).
The equipment used was similar to that described by Head
(1982). The specimens were separated from the porous stones
with a single thickness of Whatman No. 50 filter paper. The
applied pressures ranged from 25 kPa to 1,600 kPa. Each test
involved 7 load increments that were applied daily. The effect
of the stress increment ratio on the compression curve is not
considered herein. Calibrations were made of each apparatus to
reduce the effects of compliance in the measurement of sample
displacement.
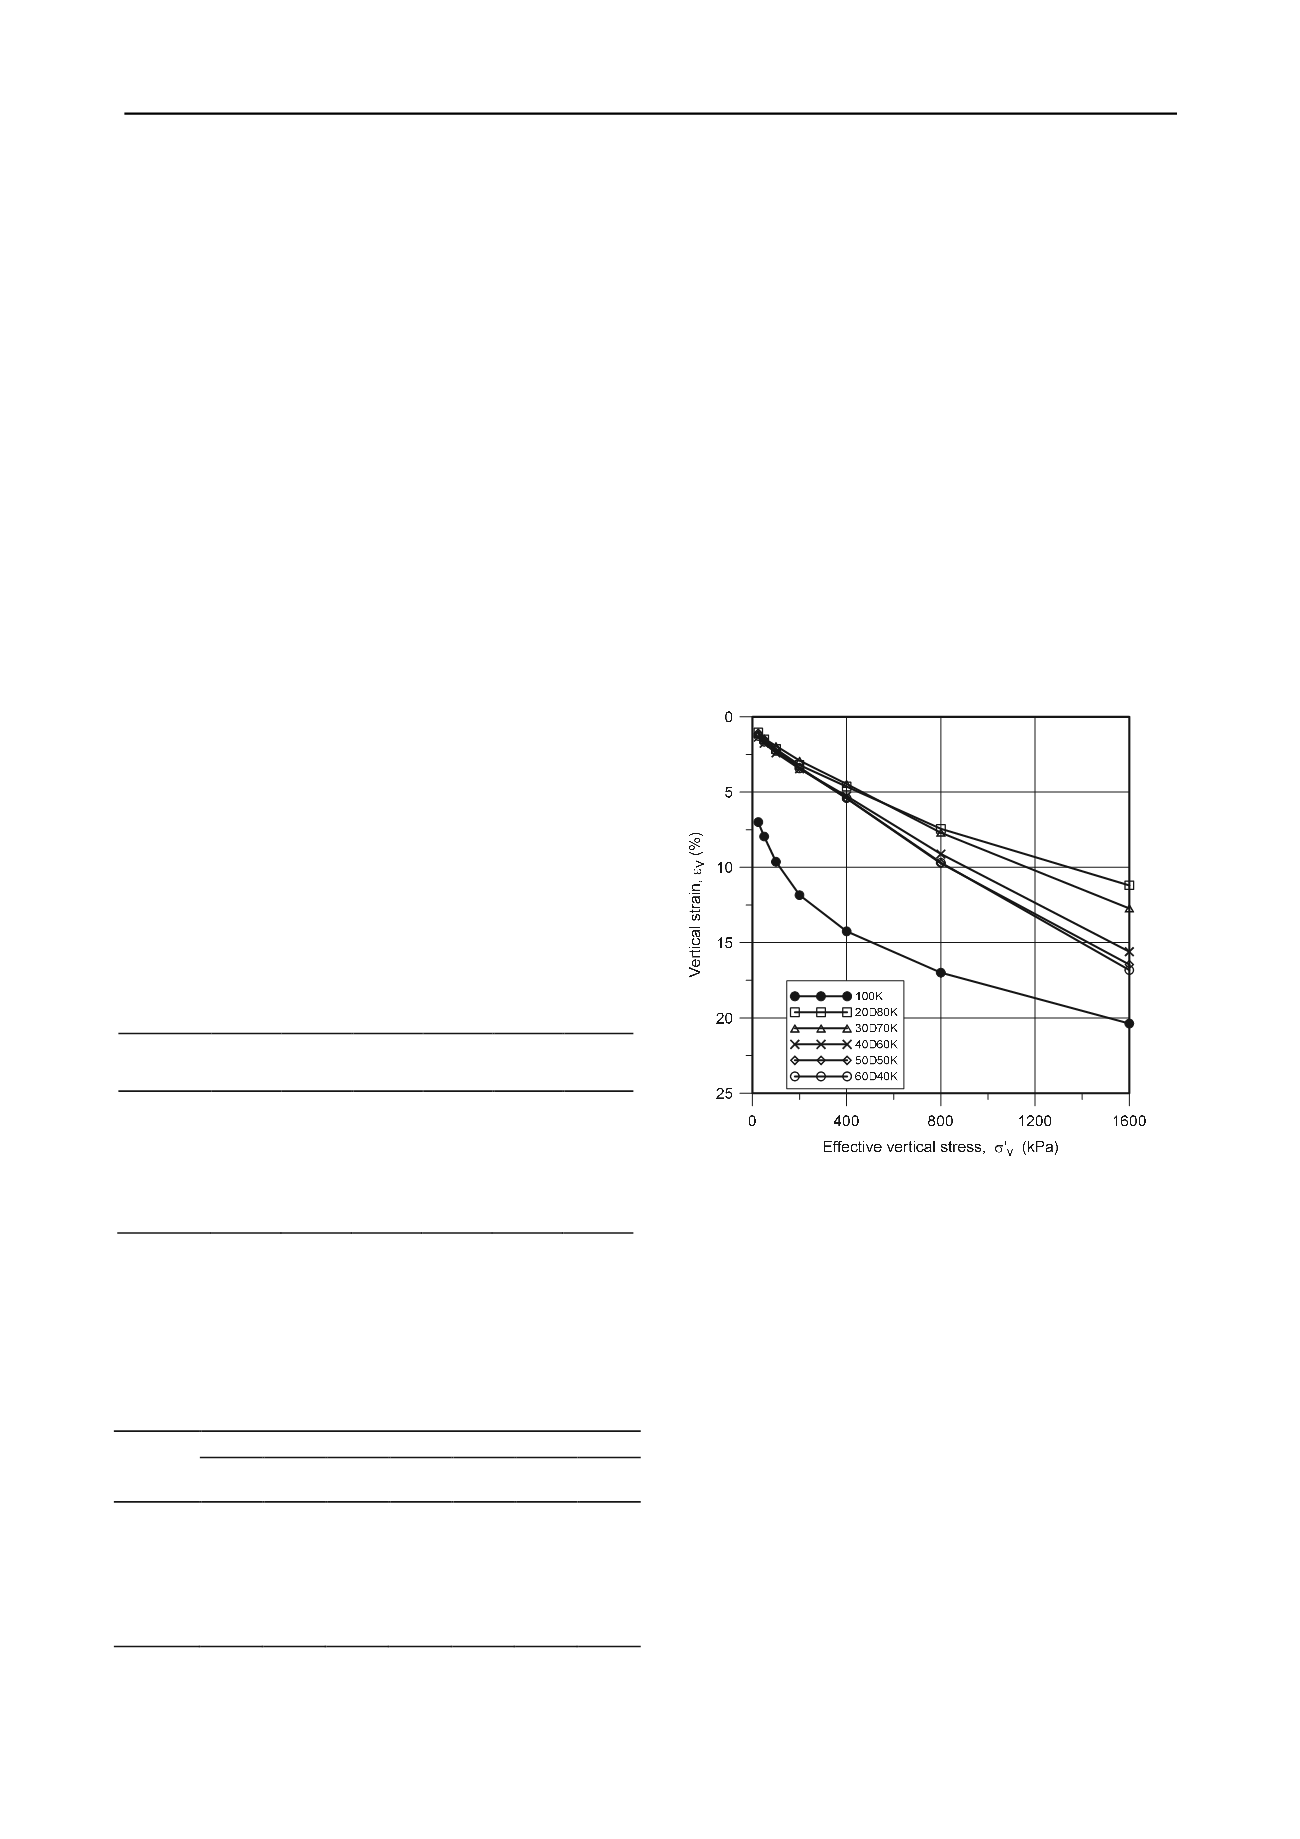
The stress-strain relationship (
v
–
’
v
plots) from
incremental one-dimensional consolidation tests, are presented
in Figure 1. It can be seen from the figure that the stress-strain
curves show different characteristic that depend on the
diatomite content.
The compression curve for 100% kaolinite is shown as
reference curve
The mixture 20D+80K shows a marked decrease of
deformation.
The mixtures of diatomite content of 30, 40, 50, and 60%
show different behavior. As diatomite content increase the
vertical strain begins to increase.
Figure 1 Stress-strain behavior on diatomite-kaolin mixtures
The variation of strain in diatomite content is shown in
Figure 2, each curve is identified with the vertical stress applied.
It can be seen from the figure that each curve shows different
characteristic that depend on the vertical stress.
For small values of the vertical stress (25 to 100 KPa) there
is a plateau between 20 to 60% of diatomite content.
From a vertical stress of 200 KPa the plateau tends to
disappear and the shape of the strain pattern denotes a
change in the behavior for high stress levels.
The stress-strain relationship (
v
–
log
’
v
plots) for different
mixtures, are presented in Figure 3. It can be seen from the
figure that there is a sudden change in the pattern when
diatomite is added to the mixture. Curve 100K represents the
general
v
–
log
’
v
relationship for random type of structure
typical of a remolded clay. Other compression curves represent
incipient structured soils.
Mixture
D + K
Stress
25 Kpa
50
Kpa
100
Kpa
200
Kpa
400
Kpa
800
Kpa
1600
Kpa
100K 6.992 7.949 9.630 11.843 14.248 16.996 20.374
20D + 80K 1.047 1.492 2.142 3.205 4.634 7.441 11.189
30D + 70K 1.134 1.445 1.941 2.913 4.453 7.693 12.724
40D + 60K 1.354 1.752 2.398 3.449 5.264 9.114 15.602
50D + 50K 1.083 1.492 2.142 3.362 5.413 9.732 16.449
60D + 40K 1.268 1.654 2.268 3.425 5.402 9.689 16.823
Mixture
D + K
w w
L
w
P
I
P
d
(
kN/m
3
) Activity
(%)
(%)
(%)
(%)
100K 43.00 56.40 28.90 27.50 11.06 0.42
20D + 80K 45.60 58.90 33.70 25.20 10.98 0.48
30D + 70K 49.00 63.75 40.25 23.50 10.70 0.51
40D + 60K 52.40 68.60 46.80 21.80 10.43 0.53
50D + 50K 55.15 72.05 51.75 20.30 9.95 0.59
60D + 40K 57.90 75.50 56.70 18.80 9.48 0.65


