338
Proceedings of the 18
th
International Conference on Soil Mechanics and Geotechnical Engineering, Paris 2013
Proceedings of the 18
th
International Conference on Soil Mechanics and Geotechnical Engineering, Paris 2013
Test program investigates the influence of the applied
surcharge, material type and the ion concentration of the pore
water on the suction and development of ice lenses. The test
apparatus essentially consists of an acrylic glass cylinder with
an inner diameter of 80 mm. The two cooling plates (4) allow
setting up a defined temperature gradient in the specimen. The
upper sealing and loading is realized through a piston. The ice
lens experiments are conducted in open-system freezing,
meaning that the specimen is connected to a storage vessel and
hence it has free access to water. To investigate the suction, the
water access is disabled so the system changes into a closed-
system freezing test. The temperature sensors (1) are distributed
over the height and record the time depending temperature
development. To determine the suction in the closed-system,
pore water pressure transducers (2) are used. The frost heave is
measured with a displacement transducer (3).
In advance, the test material is mixed with deionized water
so that the swelling and ion exchange processes have taken
place prior to commencement of the experiments. Subsequently,
the ion composition of the water is determined. The material is
filled into the cylinder in pasty condition and is consolidated in
the test apparatus by applying a defined surcharge. For the
closed-system freezing tests, the valve for the water supply is
shut. The step-freezing method is used to freeze the specimen.
Therefore, the temperature of the upper cooling plate is lowered
to a defined value meanwhile the temperature of the lower
cooling plate is still held constant. Thus, the frost migrates top
down, starting fast and slowing down over time until thermal
steady state is reached. The cylinder is lubricated with a high
vacuum silicon grease to reduce the friction between the
specimen and the acrylic glass. At the end of the test, the
specimen is pushed out of the cylinder to saw them into slices.
This allows determining the distribution of the water content
over the specimen height.
3 MATERIALS TESTED AND TESTING PROGRAMM
The development of ice lenses and suction during freezing
strongly depend on the respective material. Different materials
are chosen to investigate the influence of grain-size distribution
and the mineralogy: kaolin (K), bentonite (TS), silt (S),
limestone powder (KK) and quartz powder (Q) were chosen as
fine grained materials. Also, tests with fine sand (Fs) were
conducted. Figure 2 shows the grain size distribution and further
soil properties are given in Table 1.
Within the scope of the test program, different dependencies
shall be analyzed. Primarily, the influence of material on the
development of ice lenses as well as on the suction is analyzed.
Influences of the applied surcharge will be investigated by
applying loads of 20, 50, 100, 300 and 600 kN/m². Besides the
normal consolidated specimens with the loads as stated,
overconsolidated specimens were tested as well. Further, the
tests are conducted with 2 different temperature gradients
between the cooling plates. The influences of the ion
concentration in the pore water on the suction and the
development of ice lenses are analyzed by comparing the results
of tests with natural ion concentration in the pore water and
those with particularly enriched ion concentration in the water.
The natural ion concentration results from the exchange
etween dried material and the deionized water.
b
Table 1. Soil properties of the tested materials
K
TS
S
KK
Q
Fs
Liquid limit
w
L
[%]
55,6 134,7 22,7
-
-
-
Plastic limit
w
P
[%]
24,6
37,1
21,5
-
-
-
Hydraulic conductivity
k
[m/s]
(surcharge 100 kN/m²)
1,5·
10
-9
1,6·
10
-10
1,1·
10
-8
4,0·
10
-8
2,9·
10
-8
1,5·
10
-6
Grain density
ρ
s
[g/cm³]
2,63
2,73
2,70 2,73 2,66 2,65
Cation exchange capacity
Γ [meq/100g]
4,7
88,9
6,1
2,4
0,9
0,3
Specific surface area
A
s
[m²/g]
10,1
44,4
6,3
2,5
1,1
0,02
4 TEST RESULTS
In the following, the results of the experiments with varying
materials in combination with different surcharges will be
presented. The specimens have a natural ion concentration in
the pore water and are frosted with a temperature gradient of
1.9 °C/cm.
4.1
Frost penetration
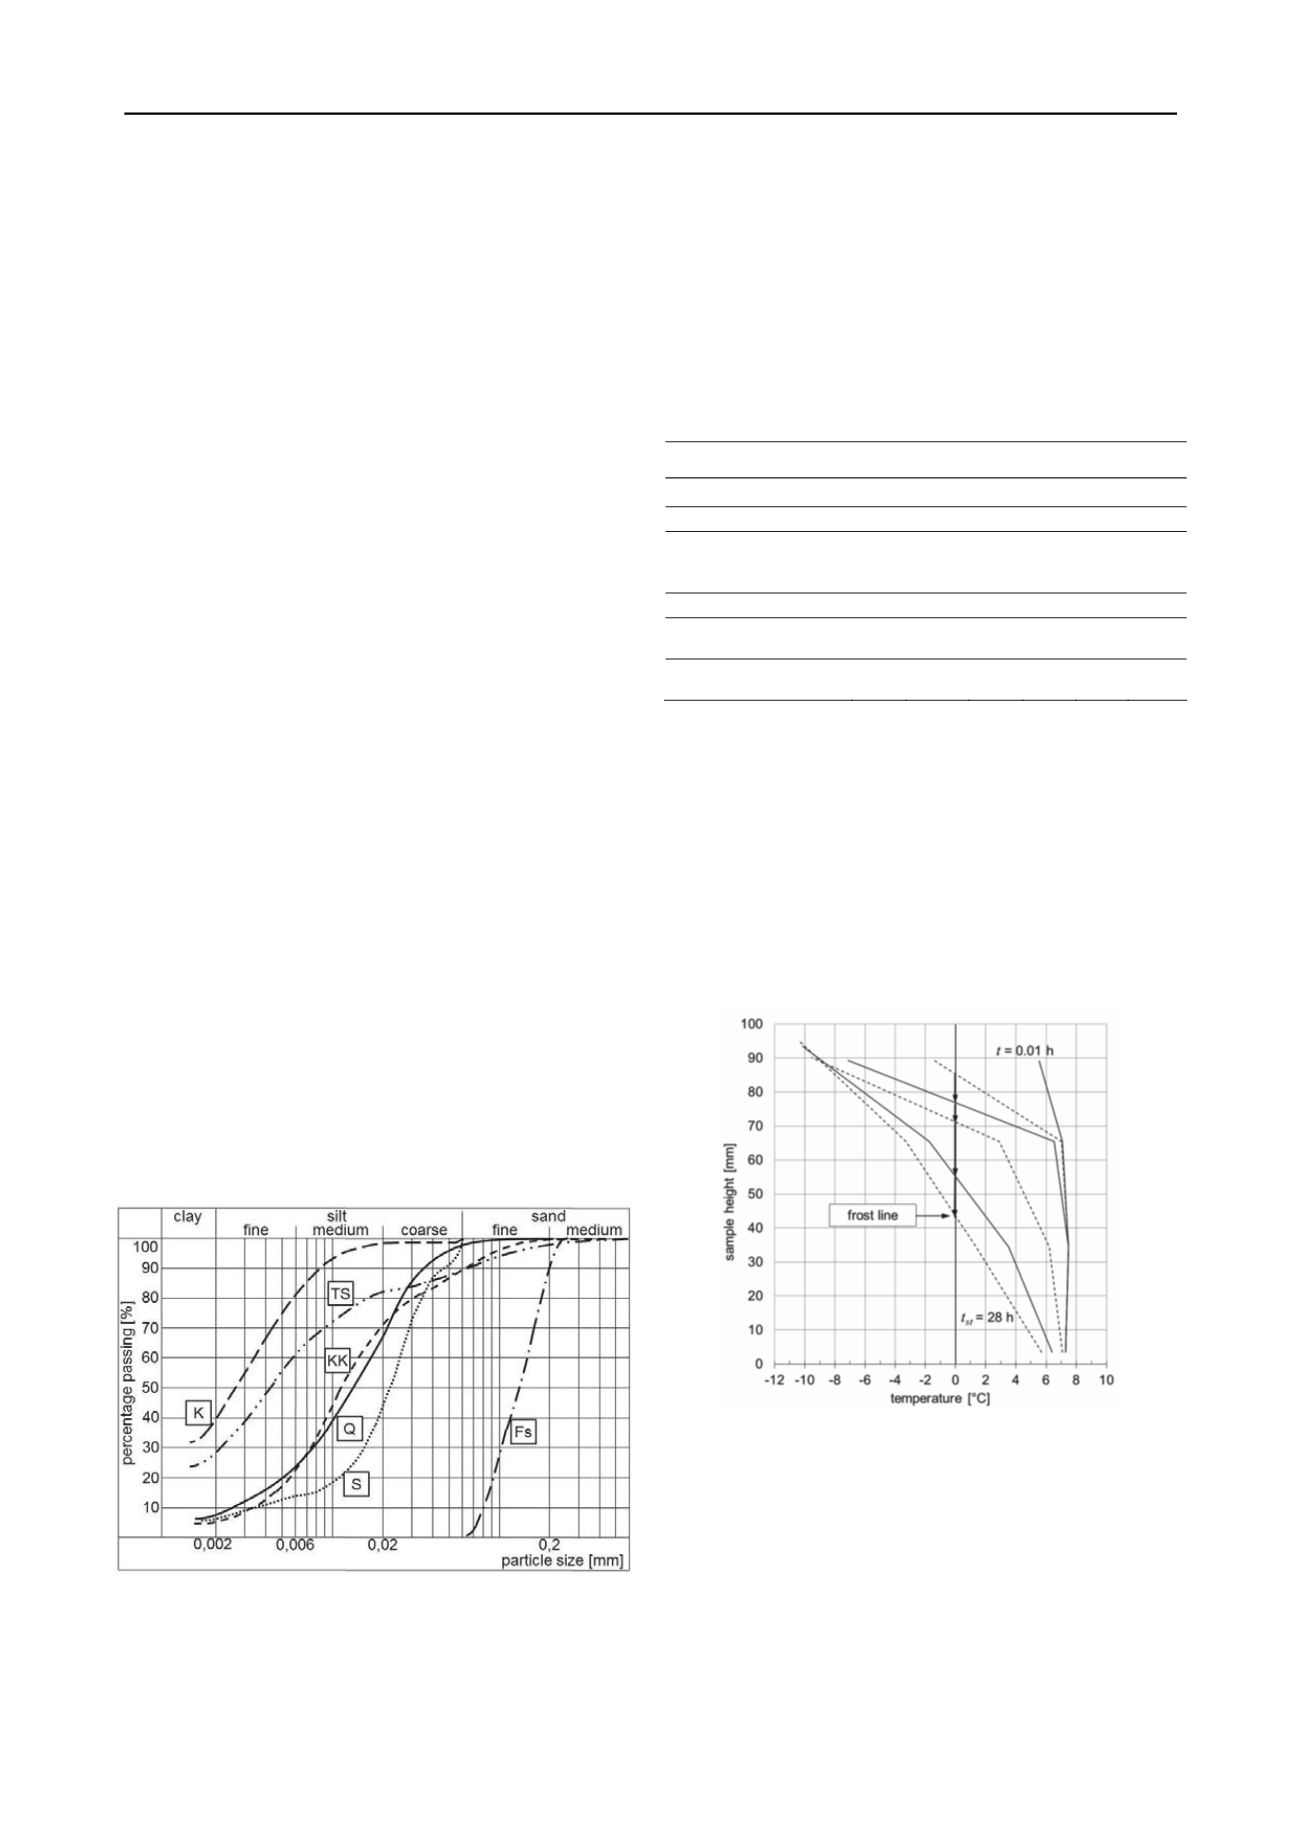
Figure 3 shows the temperature distribution over the specimen
at different times exemplarily for one test.
Figure 3. Temperature profile within the specimen (kaolin) at different
times, from right to left: 0.01 h, 0.07 h, 0.15 h, 0.83 h, 4.17 h, 28 h
The temperature of the upper cooling plate drops rapidly to
the set temperature meanwhile the temperature of the lower
cooling plate is kept constant. The temperatures at the other
sensors are decreasing time delayed until the thermal steady
state is established after the time
t
st
. Based on the diagram the
position of the frost line and their temporal shift can be
identified. The frost line is the transition between the frozen
upper sections and the unfrozen part. The position stays
constant by reaching the time
t
st
. The fast frost penetration at the
beginning is linked to a sharp temperature gradient. Only within
the steady state the requested temperature gradient appears.
Figure 2. Grain-size distribution curve of the tested materials


