237
Technical Committee 101 - Session I /
Comité technique 101 - Session I
stage, plotted in the same way as Figure 3. Also in this case, the
relation is independent of loading history and stress at SL stage,
and the relations for the two tests are nearly the same. This
result indicates that the empirical rule presented in Figure 3 is
also valid for a wide variety of loading history, at least when the
void ratio range is as small as in these tests.
The current creep strain rate is controlled by the
instantaneous yield characteristics. As typically seen from
Figures 4a and 5, the stress at which large-scale yielding starts
is not a fixed value but controlled by loading history. Kawabe et
al. (2011) showed that the hysteretic stress-irreversible strain
relations during cyclic one-dimensional compression of clay can
be adequately described by revising the proportional rule that
was originally proposed for shear tests (Tatsuoka et al. 2003).
This feature is referred to below when inferring very low creep
strain rates during otherwise cyclic loading.
3.2 Very low creep strain rates
Many clay types exhibit the Isotach viscous properties in one-
dimensional compression (e.g., Imai 1995; Niemunis and Krieg
1996; Leroueil et al.1996; Leroueil and Marques 1996: Kawabe
et al. 2011). In that case, at the ‘
loading
‘ state in the sense that
the irreversible axial strain rate,
, has been kept positive
since the start of loading, a unique effective stress is defined for
given irreversible strain and its rate. Then, the
a
a
ir
a
log
curve of a CRS test at a lower
value is located more left or
lower in the plot presented in Figure 7. The
value at the
strain-stress state,
ir
a
ir
a
) , (
a a
, that is ultimately reached in any SL
is zero. These zero-strain-rate states form the stress-strain
relation called the reference relation. The reference relation is
the same for different loading histories keeping the same sign of
, but different for different loading histories changing the
sign of
. In Figure 7, the reference relation at the ‘
loading
’
state and the one for the ‘
first unloading
‘ state, where
has
become negative for the first time since the start of loading, are
presented. Point B is located on the first unloading curve
starting from point A (on the primary loading curve). During
this unloading process, the total axial strain rate,
a
ir
a
ir
a
ir
a
(= + )
is negative, but
is kept positive while the elastic axial strain
rate
is kept negative with a negative axial stress rate. Note
again that all the strain-stress states located right of, or above,
the reference relation for ‘loading‘, including points A, B and
B’, are at the ‘loading‘ state.
e
a
ir
a
ir
a
e
a
0
Faster
Measured
�
‐log
�
relation
No creep
or : positive or negative creep
�
log
�
Reference relation for ‘
loading
’
Reference relation for
‘
first unloading
’
Primary loading at a constant
positive total strain rate
First unloading at a
constantnegative
total strain rate
0
ir
a
B
A
C
B’
C’
Figure 7 Illustration of
a
a
log
and creep in Isotach theory
In SL at the ‘
loading
’ state (where
> 0), as the initial
strain rate at the start of SL becomes lower, the reference
relation is reached faster while the residual creep strain rate
after the same elapsed time since the start of SL becomes
smaller. For example, the reference relation is reached much
faster when SL starts from point B than when SL starts from
point A. By taking advantage of this feature, in a relatively short
period by starting after having made some unloading (such as
point A to point B), we can reach the creep behaviour at very
low strain rates that can be observed only after a very long
period when SL starts during otherwise primary loading.
ir
a
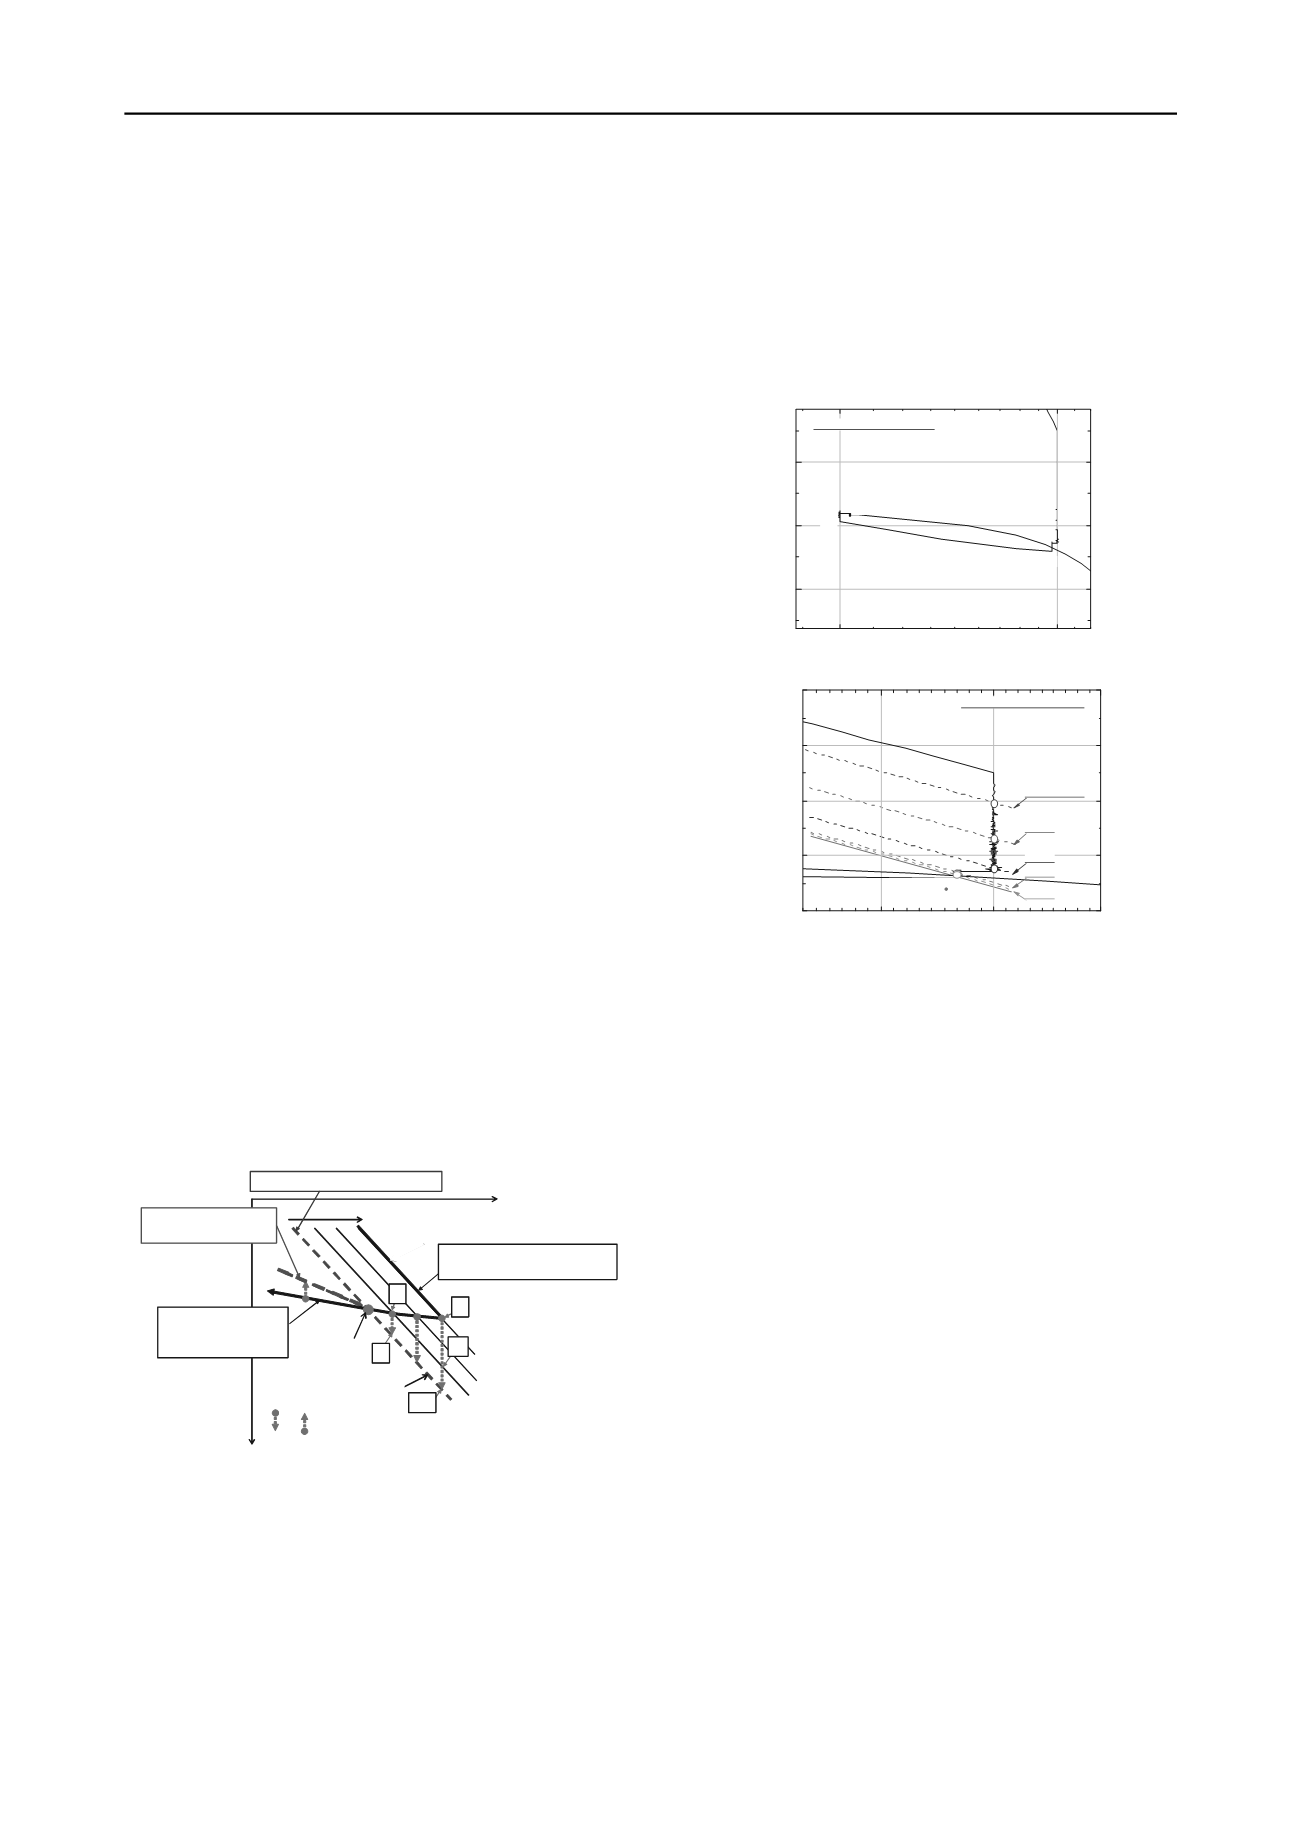
Figure 8a shows the
a
a
log
relation from a CRS test on
kaolin clay, in which CRS primary loading was followed by: 1)
a SL stage, SL1; 2) a small unloading; 3) another SL stage,
SL2; and 4) a global RL another SL stage, SL4. Figure 8b is the
zoom-up of the behaviours around the stages 1) – 3). Despite
that the viscous properties of Fujinomori clay is slightly non-
Isotach (Kawabe et al. 2009), the result from a similar test
performed as the above (test FJM1104, cf. Figure 10) was
analysed below in the framework of Isotach viscous properties.
a)
300
600
9.5
9.0
8.5
SL4
SL3
SL2
Test Name: KLN1101
Axial strain,
a
(%)
Axial stress,
a
(kPa)
SL1
b)
570
600
630
9.5
9.0
8.5
8.0
7.5
1E-9
1E-8
1E-7
1E-6
1E-5 %/sec
Axial strain,
a
(kPa)
Axial stress,
a
(kPa)
Test Name: KLN1101
a(creep)
=0
Figure 8. a) Zoom-upped
a
a
log
relation; and b) behaviours
around SL1 and SL2 stages, test KLN1101
Figures 9a and 10a show the
Δt
log
log
a(creep)
relations
from tests KLN1101 and FJM1104, where SL1 starts during
otherwise the primary loading and SL2 starts during otherwise
the first unloading following SL1 (see Figure 8a). It may be
seen that the creep strain rate,
a(creep)
Δ
Δt
, decreases linearly
with the logarithm of the elapsed time,
, since the start of SL
at both SL1 stages. The relations at SL1 and SL2 are different,
showing that the elapsed time since the start of respective SL
stages,
is not the parameter that controls the creep
behaviours at different stresses,
SL
Δt
. Figures 9b and 10b show
the
a(creep)
a(creep)
log
log
Δ
relations from these two tests.
The two relations at SL1 are nearly straight until
a(creep)
becomes about 10
-7
%/sec. The relations at SL2 stage are utterly
different from the above.
Referring to Figure 7, according to the Isotach theory, the
creep behaviour from point B to point C is equivalent to the one
from point B’ to point C’ at the last part of the SL that has
started from point A at the primary loading state. The
value
is the same at points B and B’ and at points C and C’.
Correspondingly, in Figure 8b, the
a
a
ir
a
log
relations for
different
values that are in parallel to each other have been
depicted (i.e., broken lines). Each of these relations passes
different
a a
ir
a
(
) ,
states where different strain rate was
observed. Following this procedure, in Figures 9b and 10b, the
measured relations of SL2 have been parallel-shifted upwards to
be connected to the end part of the relation of the respective
SL1 stages. The combined relations can be regarded as the
continuous relations that would have been obtained if SL1 had
continued longer than the actual tests.
The obtained relations exhibit a drastic decrease in the slope
toward eventually zero
a(creep)
. This trend is consistent with


