232
Proceedings of the 18
th
International Conference on Soil Mechanics and Geotechnical Engineering, Paris 2013
Proceedings of the 18
th
International Conference on Soil Mechanics and Geotechnical Engineering, Paris 2013
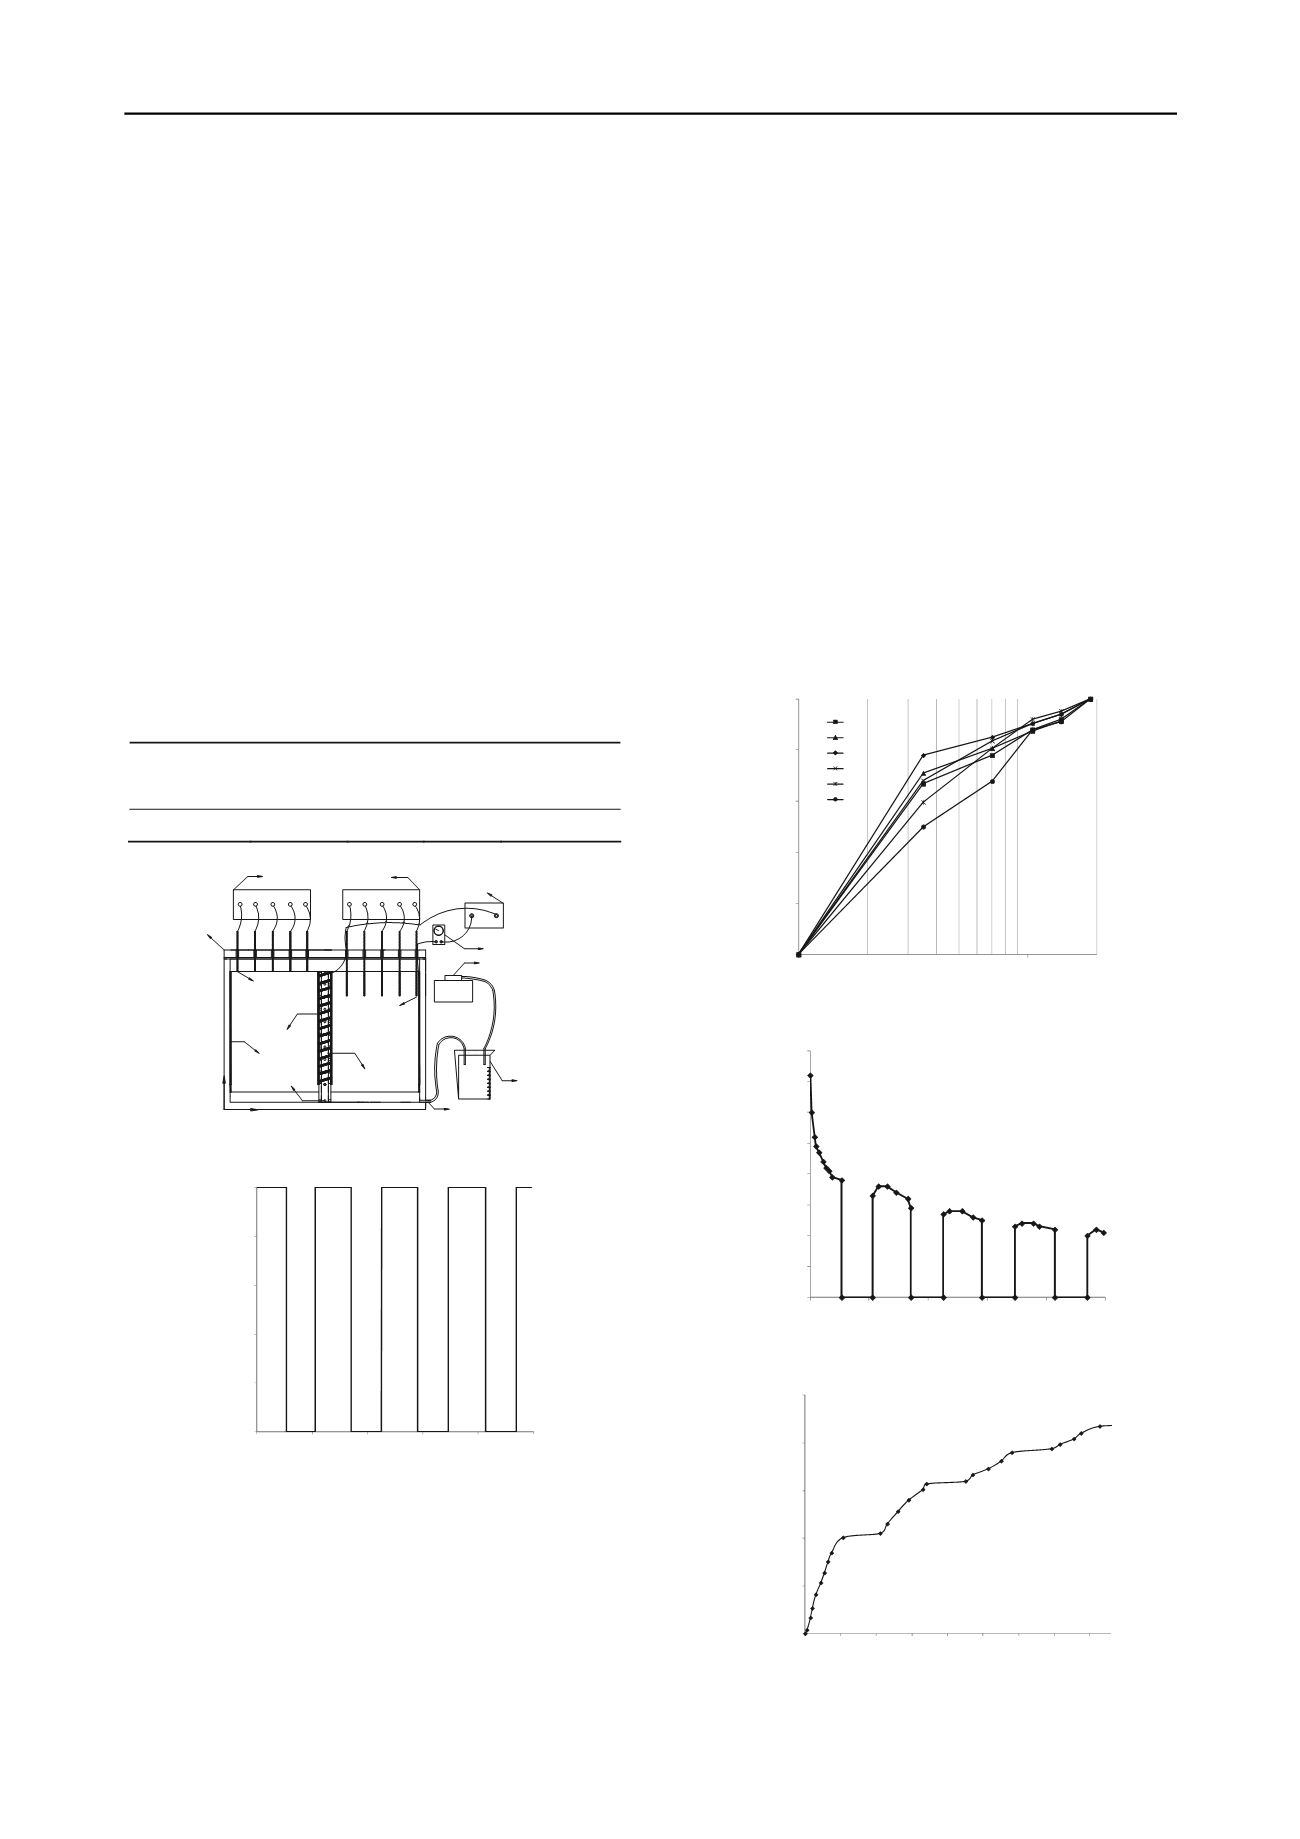
2 TEST ON ELECTRO-OSMOTIC CONSOLIDATION
An axial-symmetrical electro-osmosis apparatus made of
plexiglas with a radius of 18.8 cm and a height of 20 cm shown
in Fig. 1 is developed to conduct the electro-osmotic
consolidation test on kaolin clay. The radius of the central
cylindrical drainpipe with many small holes on it is 1.25 cm.
After convolving a piece of geotextile that only water can pass
through, an iron wire is then convolved on the geotextile in a
spiral form to be the cathode. The anode consists of many
vertical iron wires inserted in the soil sample and cling to the
inner surface of the apparatus. A set of monitoring device is also
developed to measure voltage distribution, water discharge,
surface settlement and current during the electro-osmotic
consolidation. A vacuum pump and a gas-water separation
device are used to collect the water discharged from the soil
sample. A multimeter is installed in the circuit to monitor the
current.
The basic properties of the kaolin clay used in the test are
listed in Table. 1.
After filling the test device with saturated kaolin clay, an
intermittent DC electric filed shown in Fig. 2 was applied to the
soil sample. The total testing time was 100 hours and the
conduction time was 57 hours.
Table 1 Basic property of kaolin clay
Initial water
content,
w
/%
Degree of
saturation,
S/(%)
Liquid
limit,
w
L
/(%)
Plastic
limit,
w
p
/ (%)
Specific
gravity,
G
s
100
100
73
31
2.61
Top cap
moisture
trap
z
r
Soil Sample
displacement
sensor
Voltage
sensor
Cathode
drain hole
Vertical drain
Anode
Data acquisition instrument
power source
Vacuum pump
Outlet of water
ammeter
Figure 1. Testing facility for electro-osmotic consolidation
0
3
6
9
12
15
0
20
40
60
80
10
Voltage/V
t
/h
0
Figure 2. Voltage applied between the anode and the cathode
Fig. 3 shows the voltage distribution along the radial
direction during the electro-osmotic consolidation. In most of
the previous study, the voltage was supposed to be steady and
linear. However, the test result illustrates that the voltage first
increases with time with the largest increase near the cathode
and the smallest increase near the anode. This is mainly caused
by the change of soil resistance near the cathode. Along with the
electro-osmosis, the soil near the cathode began to seperate
from the electrode so that the soil resistance near the cathode
increased, which then resulted the increase of the voltage neer
the cathode. After 10 hours, the voltage began to decrease and
finally the voltage near the cathode was even smaller than that
at the beginning. During the electro-osmotic consolidation, the
pore water moved from the anode to the cathode and some
cracks gradually generated near the anode, which made the soil
resistance near the anode to increase, and this further resulted
the decrease of the voltage near the cathode. Therefore, the
electrical conductivity changes with time and position and it is
important to consider this change in the theoretical and
numerical analysis.
The current across the soil mass is shown in Fig. 4 with an
initial value of 0.72 A, and decrease to about 0.21 A finally.
The discharge of water is demonstrated in Fig. 5 and 2294 ml
water was discharged in total. When the power was switched
off, the current decreased to 0 and the drainage speed almost
decreased to 0. When the power was once again turned on then,
the movement of the pore water was accelerated and the current
first increased and after it decreased again. This was because the
pore water flowed back from the anode to the cathode under
hydraulic gradient after the current was cut down, which made
the moisture distribution to be more uniformity and the
resistance therefore decreased.
0
3
6
9
12
15
1
1
Voltage/V
Distanceto the cathode/cm
0
t=0h
t=2h
t=10h
t=30h
t=60h
t=100h
2
3 4 5 6 7 8 9
18.8
Figure 3. Distribution of the voltage along the radial direction
0
0.1
0.2
0.3
0.4
0.5
0.6
0.7
0.8
0
20
40
60
80
10
Current/A
t
/h
0
Figure 4. Current during electro-osmotic consolidation
0
500
1000
1500
2000
2500
0
10
20
30
40
50
60
70
80
Discharge of water/ml
t
/d
Figure 5. Discharge of water during electro-osmotic consolidation


