242
Proceedings of the 18
th
International Conference on Soil Mechanics and Geotechnical Engineering, Paris 2013
Proceedings of the 18
th
International Conference on Soil Mechanics and Geotechnical Engineering, Paris 2013
Figure 5 shows that for both pumice sands there is
considerable particle breakage during the drained shearing and
that this is progressively more severe as the confining pressure
increases. Note that the Japanese pumice is much finer than the
New Zealand material but the general features of particle
crushing are similar for both materials. One interesting
observation for the NZ material is that there is much less
particle crushing for the undrained test following consolidation
to 1600 kPa than for the drained test from the same
consolidation pressure. The reason is because of the differing
stress paths. For the drained test the stress paths for drained
compression, if plotted on the set of axes in Figure 4, is a line of
slope +3 upwards and towards the right. On the other hand since
the specimens are loose the undrained effective stress path will
move to the left and so subject the sand particles to lower
effective stresses.
Figure 6 presents a surprising insight into the deformation
behaviour of these materials. In the drained triaxial test the axial
deformation and the volume change are measured. From this it
is possible, with the usual assumption that the specimen
deforms as a right circular cylinder, to determine the change in
diameter of the specimen. The figure shows that for higher
consolidation pressures there is zero or very little change in
diameter of the specimen. In fact, for the New Zealand pumice
for consolidation pressures of 400 and 1600 kPa it is seen that
the diameter of the specimen actually decreases, that is there is a
decrease in length because of the compression and also lateral
compression. In our view this is a consequence of the large
amount of particle crushing at these higher consolidation
pressures. This observation was first made in the paper by
Pender at al (2006) on the properties of New Zealand pumice
sands.
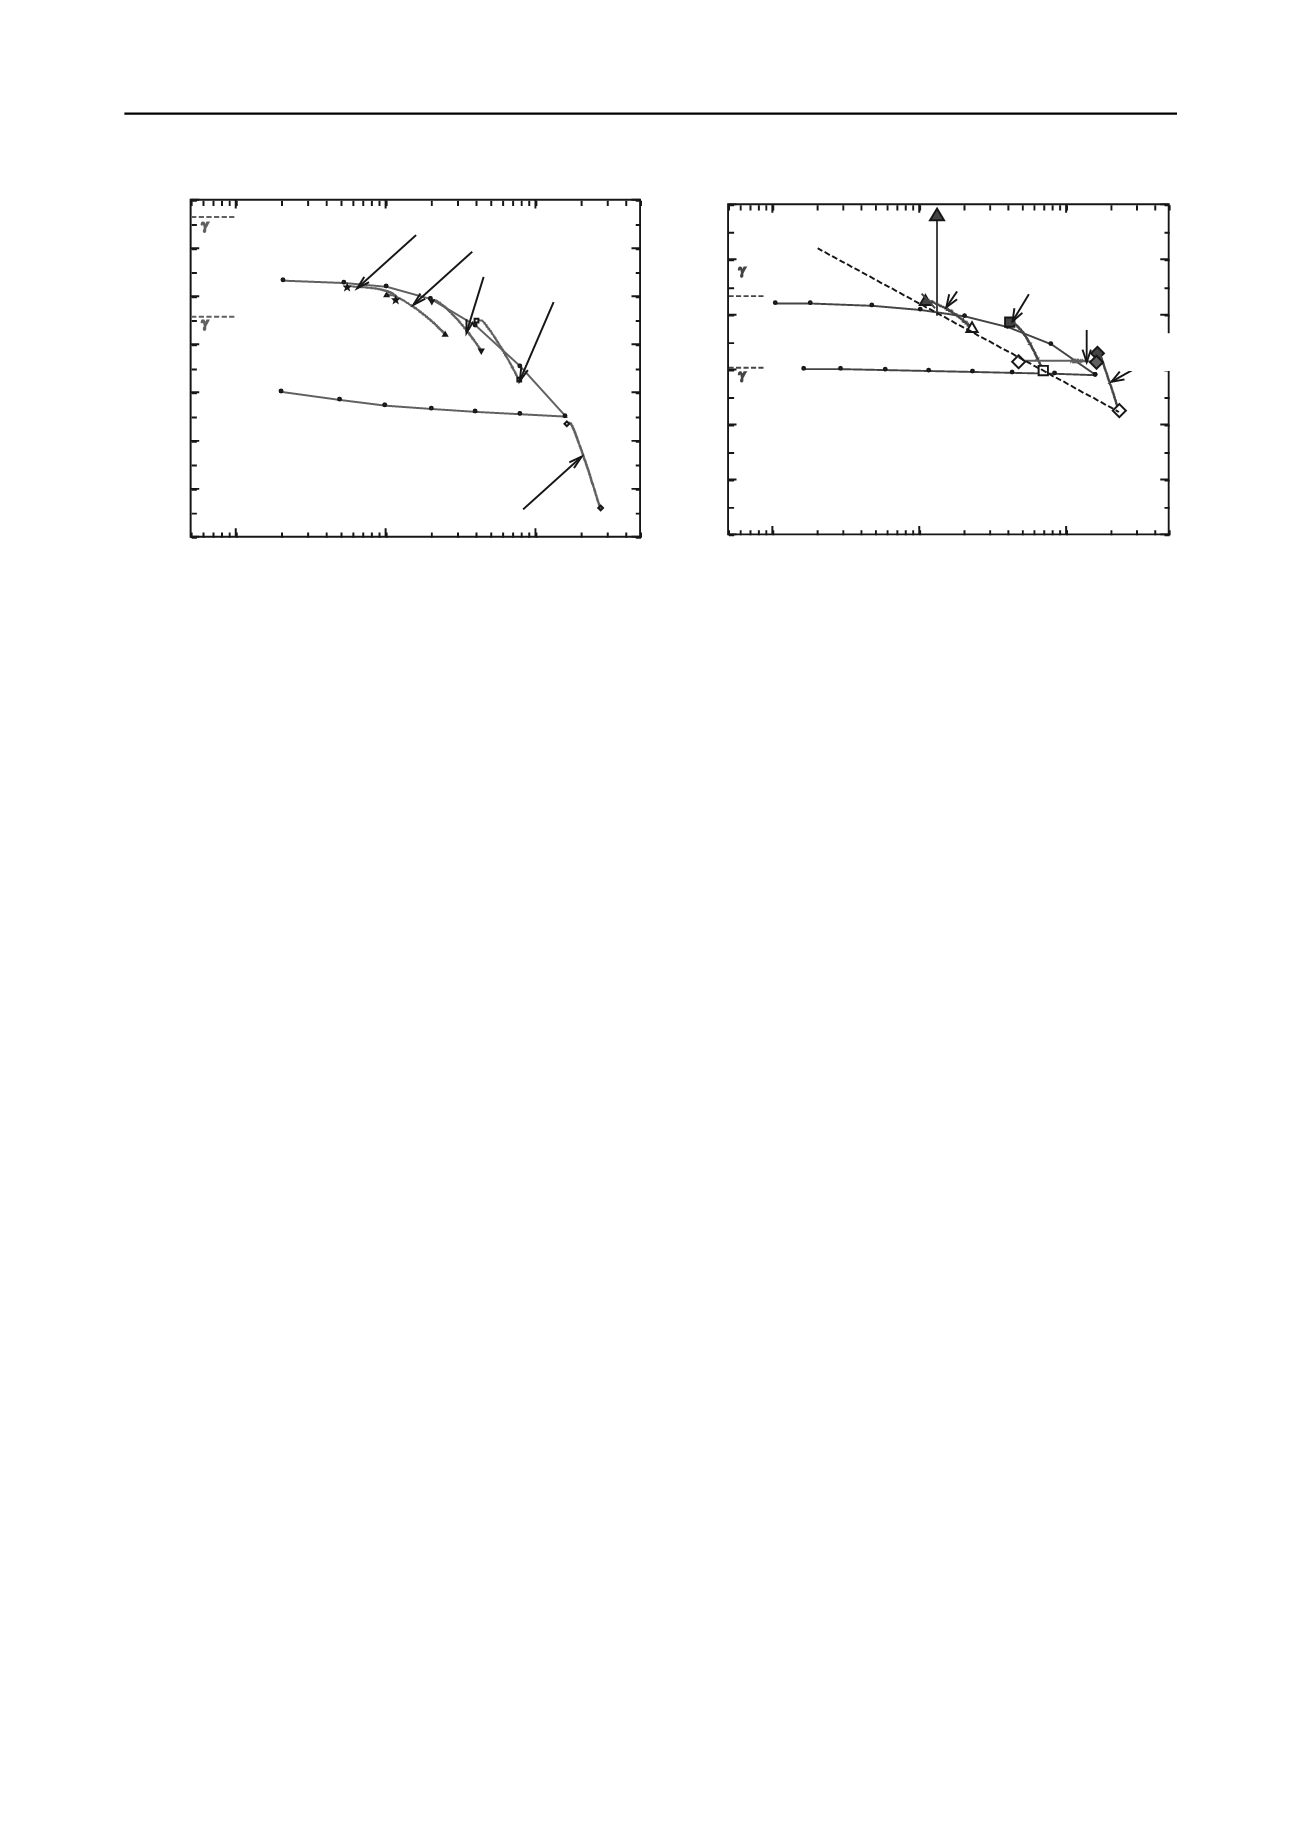
Figure 7 plots the dry unit weight of the specimens tested on
the vertical axis against the logarithm of the mean principal
effective stress on the horizontal axis. In the Critical State
literature diagrams such as this are plotted with the void ratio on
the vertical axis. However, one of the difficulties of dealing
with material having voids within the particles is that the value
for the “operational”
solid density is unclear. So in Table 1 the
values given for the solid density are reasonable indications but
not exact values. One way to overcome this difficulty is to use
the dry unit weight rather than the void ratio, hence the vertical
axes in Figure 7. The beginning and end points of the various
shear tests are shown in Figure 7 along with the hydrostatic
compression curves. For the New Zealand pumice results in
Figure 7b a dotted straight line is drawn through the end points.
However, this cannot be regarded as a critical state line as
Figures 2 and 3 show that the state of the specimens has not
reached a condition with constant q and constant volume.
3 CONCLUSIONS
The main conclusions derived from this brief comparison of the
properties of New Zealand and Japanese pumice sands are:
The properties of the materials are very similar, despite
their different origins and particle size distributions.
In drained triaxial testing, neither the shear stress or the
specimen volume reaches a steady value even at axial
strains of 20% (Figs. 2 & 3).
During drained shearing particle crushing is
considerable (Fig. 5).
There is no well-defined angle of shear resistance (Fig.
4).
At high confining pressures the lateral deformation
during drained shear indicates behaviour close to one-
dimensional compression (Fig. 6).
Figure 7 indicates that the materials have not reached a
critical state condition.
4 ACKNOWLEDGEMENTS
We are very grateful to the Japan Society for the Promotion of
Science (JSPS) for support. This research has been partially
funded by a JSPS Grant-in-Aid for Young Scientists (B)
(No.23760448).
5 REFERENCES
Kikkawa, N., Orense, R.P. & Pender, M.J. (2011). ”Mechanical
behaviour of loose and heavily compacted pumice sand,”
Proc.,
14
th
Asian Regional Conference on Soil Mechanics and
Geotechnical Engineering
, Hong Kong, 23-27 May 2011, Paper
214. 6pp.
Pender, M J, Wesley, L D, Larkin, T J and Pranjoto, S (2006)
“Geotechnical properties of a pumice sand.” Soils and
Foundations, Vol. 46, No. 1, pp. 69-81.
Wesley, L. D., Meyer, V. M., Pranjoto, S, Pender, M. J., Larkin,
T. J. and Duske, G. C. (1999)
“Engineering properties of
pumice sand” Proc. 8th Australia
-NZ Conference on
Geomechanics, Hobart, Vol. 2, 901-908.
10
1
10
2
10
3
10
9
8
7
6
5
4
Dry unit weight
d
(kN/m
3
)
Mean effec tive princ ipal stress
p
' (kPa)
130kPa
NZ pumice
100kPa
NZ pumice
1600kPa,CU test
NZ pumice
1600kPa
NZ pumice
400kPa
dmin
NZ pumice
dmax
NZ pumice
10
1
10
2
10
3
11
10
9
8
7
6
5
4
Dry unit weight
d
(kN/m
3
)
Mean effec tive princ ipal stress
p
' (kN/m
2
)
JPN pumice,50kPa
JPN pumice,100kPa
JPN pumice,200kPa
JPN pumice,400kPa
JPN pumice,1600kPa
dmax
JPN pumice
dmin
JPN pumice
(a) JPN pumice
(b) NZ pumice
Figure 7. Paths of dry unit weight against mean principal effective stress for the hydrostatic compression and drained triaxial tests.


