245
Technical Committee 101 - Session I /
Comité technique 101 - Session I
Proceedings of the 18
th
International Conference on Soil Mechanics and Geotechnical Engineering, Paris 2013
3.
RESULTS AND DISCUSSION
3.1. Deformations
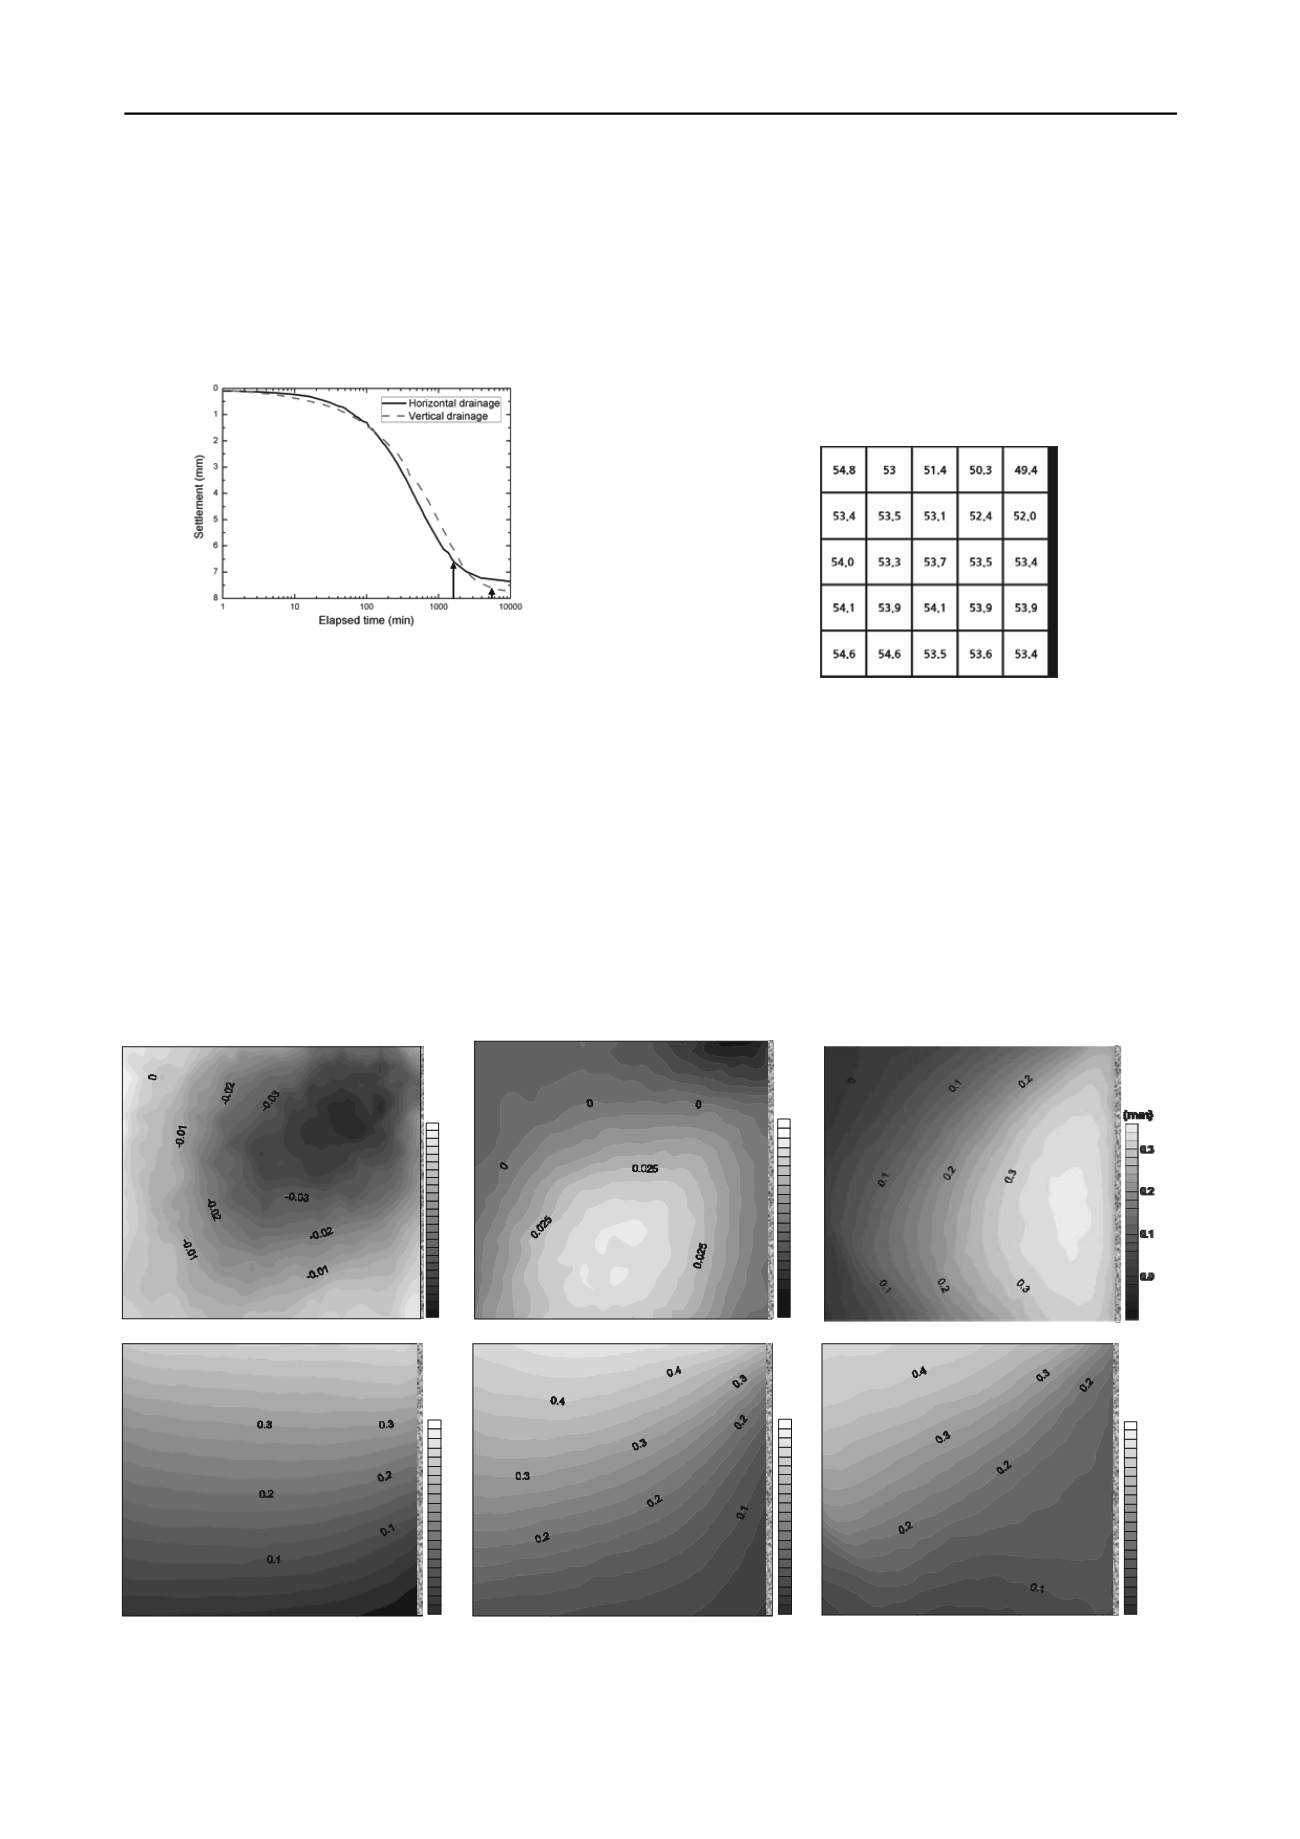
Figure 3 shows time-settlement curve for 200 kPa to 300 kPa
vertical stress increment of both tests under vertical and
horizontal drainages. Time for completion of consolidation in
horizontal drainage based on excess pore pressure response is
far shorter (3 times) than that for vertical drainage, as expected.
1625
5188
Time for
U
ave
=100 %
Figure 3. Time-Settlement curve of consolidation tests
The total consolidation process was divided into 18 and 20
stages for horizontal and vertical drainage condition to achieve
the optimum condition of image analysis with a vertical strain
interval of 0.28 %. The horizontal and vertical displacement
increment contours were drawn for each section using 1024
displacement vectors resulting from image analysis.
Interpretation results for horizontal drainage reveals 3 distinct
stages based on inner soil displacements. Figure 4 to 6 show
representative displacement increment contours under
horizontal drainage for “early”, “intermediate” and “last” stages
of consolidation, corresponding to 0 to 4%, 40 to 46%, and 78
to 82% of average degree of consolidation,
U
, respectively.
ave
In the early stage, significant horizontal displacements were
observed, and they were increasing, approaching drained
boundary. In the intermediate stage, only minor horizontal
displacements were observed. However, in the last stage, even
though they were small, displacements to undrained boundary
were observed. So, it is found out that significant horizontal
displacements occurred in case of horizontal drainage condition
under vertical compression and they were highly dependent on
consolidation progress. Furthermore, horizontal displacement
toward drained boundary is dominant throughout entire process
of consolidation and it led into uneven void ratio distribution
after completion of consolidation (decreasing void ratio as
approaching drained boundary). Figure 7 indicating water
content distribution after test provides its strong evidence, with
lower values near drained boundary.
Figure 7. Final water content distribution of horizontal drainage
Horizontal displacements for horizontal drainage under
vertical loading can be explained by progressive consolidation
process from drained boundary. In the early stage, consolidation
near drained boundary proceeds quickly with decreasing void
ratio, and decrease of void ratio can be induced by horizontal
soil displacements (i.e. soils imported from nearby zone) under
equal vertical strain condition of test. In the intermediate stage,
consolidation rate in the horizontal plane is not much different
because of relatively uniform horizontal gradients of flow, and
thus minor horizontal displacements are observed. But, in the
last stage, dissipation of pore pressure remnant left in zone near
undrained boundary invokes infinitesimal horizontal
displacements inversely.
(mm)
-0.05
-0.04
-0.03
-0.02
-0.01
0
0.01
-0.05
-0.03
-0.01
0.01
0.03
0.05
(mm)
(a) Horizontal displacement increment contours
0
0.1
0.2
0.3
0.4
0.5
(mm)
0.0
0.1
0.2
0.3
0.4
0.5
(mm)
0.0
0.1
0.2
0.3
0.4
0.5
(mm)
(b) Vertical displacement increment contours
Figure 4. Early stage of consolidation Figure 5. Intermediate stage of consolidation Figure 6. Last stage of consolidation
(
U
ave
= 0 ~ 4%) (
U
ave
=40 ~ 46%) (
U
ave
=78 ~ 92%)


