253
        
        
          Technical Committee 101 - Session I /


            Comité technique 101 - Session I


            Proceedings of the 18


            th


            International Conference on Soil Mechanics and Geotechnical Engineering, Paris 2013


          P2-S2
        
        
          w = 25.8%
        
        
          -0,8
        
        
          -0,4
        
        
          0,0
        
        
          0,4
        
        
          0,8
        
        
          1,2
        
        
          0,1
        
        
          1
        
        
          10 100 1000 10000
        
        
          Time, t (min)
        
        
          Specimen length change (mm)
        
        
          a
        
        
          σ'n=25 kPa
        
        
          σ'n=75 kPa
        
        
          σ'n=200 kPa
        
        
          σ'n=600 kPa
        
        
          (a)
        
        
          .
        
        
          .
        
        
          .
        
        
          .
        
        
          .
        
        
          .
        
        
          P1-S2
        
        
          w = 45.8%
        
        
          0,0
        
        
          0,2
        
        
          0,4
        
        
          0,6
        
        
          0,8
        
        
          1,0
        
        
          0,1
        
        
          1
        
        
          10 100 1000 10000
        
        
          Time, t (min)
        
        
          Specimen length change (mm)
        
        
          a
        
        
          σ'n=25 kPa
        
        
          σ'n=50 kPa
        
        
          σ'n=100 kPa
        
        
          σ'n=200 kPa
        
        
          (b)
        
        
          .
        
        
          .
        
        
          .
        
        
          .
        
        
          1
        
        
          .
        
        
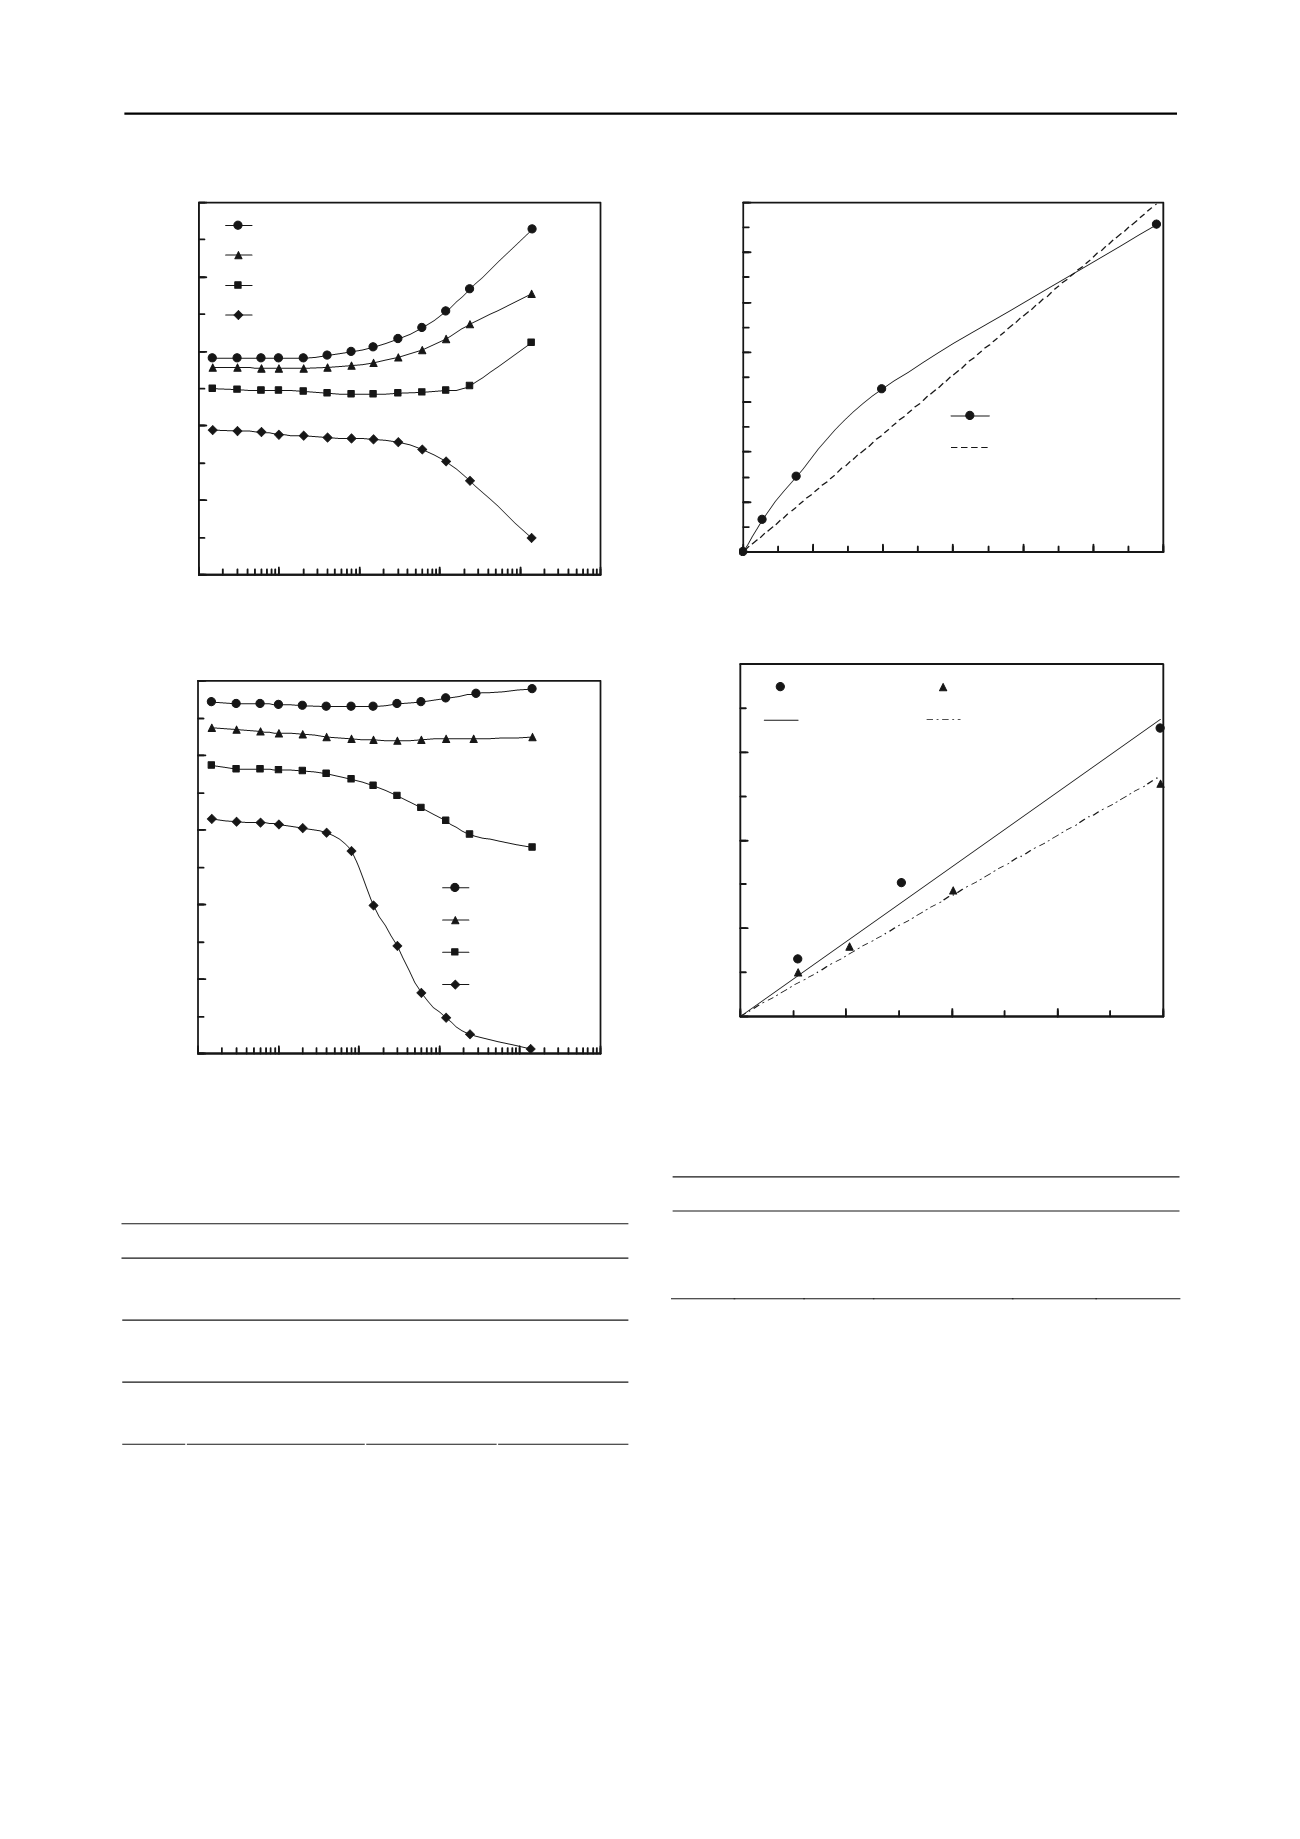
          Figure 1. Typical results from the consolidation stage of ring shear tests.
        
        
          Table 4. Soil behavior during the consolidation stage of ring shear tests.
        
        
          Soil
        
        
          Moisture content


            w


          (%)
        
        
          Expansion
        
        
          Compression
        
        
          31.2
        
        
          25, 75
        
        
          a
        
        
          250, 800
        
        
          a


            P1-S2


          45.8
        
        
          25, 50
        
        
          100, 200
        
        
          27.0
        
        
          25, 75, 200
        
        
          600


            P2-S1


          47.1
        
        
          ---------
        
        
          25, 50, 100, 200
        
        
          25.8
        
        
          25, 75, 200
        
        
          600


            P2-S2


          46.4
        
        
          25
        
        
          50, 100, 200
        
        
          a
        
        
          Values of effective normal stress


            σ’


            n


          (kPa) used in the tests
        
        
          clay fraction > 50% and a liquid limit between 60 and 220. The
        
        
          fitting of the same experimental data with a linear failure
        
        
          envelope is applied in Figure 2b, without considering the
        
        
          measurement corresponding to the maximum effective normal
        
        
          stress. As a result, a very high correlation coefficient, R
        
        
          2
        
        
          , is
        
        
          obtained indicating that the failure envelopes of the soils with
        
        
          optimum water contents can be considered as linear for
        
        
          effective normal stresses up to 250 kPa. Typical residual failure
        
        
          envelope obtained from specimens prepared with moisture
        
        
          contents ranging from 46% to 47%, is also presented in Figure
        
        
          2b. It can be stated with confidence  that these failure envelopes
        
        
          P2-S2, w = 25.8%
        
        
          (a)
        
        
          τ
        
        
          r
        
        
          = 0.1181σ'
        
        
          n
        
        
          R
        
        
          2
        
        
          = 0.9269
        
        
          0
        
        
          10
        
        
          20
        
        
          30
        
        
          40
        
        
          50
        
        
          60
        
        
          70
        
        
          0 100 200 300 400 500 600
        
        
          Effective normal stress, σ'
        
        
          n
        
        
          (kPa)
        
        
          Residual shear stress, τ
        
        
          r
        
        
          (kPa)
        
        
          Curved envelope
        
        
          Linear envelope
        
        
          P2-S2
        
        
          (b)
        
        
          τ
        
        
          r
        
        
          = 0.17σ'
        
        
          n
        
        
          R
        
        
          2
        
        
          = 0.9729
        
        
          τ
        
        
          r
        
        
          = 0.137σ'
        
        
          n
        
        
          R
        
        
          2
        
        
          = 0.9884
        
        
          0
        
        
          10
        
        
          20
        
        
          30
        
        
          40
        
        
          0
        
        
          50
        
        
          100
        
        
          150
        
        
          200
        
        
          Effective normal stress, σ'
        
        
          n
        
        
          (kPa)
        
        
          Residual shear stress, τ
        
        
          r
        
        
          (kPa)
        
        
          w = 25.8% w = 46.4%
        
        
          Figure 2. Typical residual failure envelopes from ring shear testing.
        
        
          Table 5. Values of residual friction angle


            φ’


            R


          (degrees).
        
        
          Soil


            w


            opt


            w


            opt


            w= 46% – 47%


          Difference (%)


            P1-S2


          7.3
        
        
          a
        
        
          8.8
        
        
          b
        
        
          8.8
        
        
          17.0
        
        
          c
        
        
          0.0
        
        
          d


            P2-S1


          8.4
        
        
          a
        
        
          9.1
        
        
          b
        
        
          8.7
        
        
          7.7
        
        
          c
        
        
          4.4
        
        
          d


            P2-S2


          6.7
        
        
          a
        
        
          9.6
        
        
          b
        
        
          7.8
        
        
          30.2
        
        
          c
        
        
          18.8
        
        
          d
        
        
          a
        
        
          For all values of effective normal stress used in the tests
        
        
          b
        
        
          For values of effective normal stress up to 250 kPa
        
        
          c
        
        
          Between the two angle values determined for w
        
        
          opt
        
        
          d
        
        
          Between angles determined for w
        
        
          opt
        
        
          (σ’
        
        
          n
        
        
          ≤ 250 kPa) and w= 46%-47%
        
        
          are also linear because the resulting correlation coefficients
        
        
          range from 0.98 to 0.99. Linear residual failure envelopes were
        
        
          also obtained from ring shear tests conducted on Greek clayey
        
        
          soils with effective normal stresses ranging from 50 to 400 kPa
        
        
          (Kalteziotis 1993).
        
        
          The values of the residual friction angle, φ’
        
        
          R
        
        
          , obtained in this
        
        
          investigation, are summarized in Table 5. These values are
        
        
          similar to those reported by other researchers (Bishop et al.
        
        
          1971) and were determined after it was ascertained that the
        
        
          values of residual cohesion, c’
        
        
          R
        
        
          , are negligible and can be set
        
        
          equal to zero. If the curvature of the failure envelopes for
        
        
          optimum water contents is not taken into consideration and all
        
        
          experimental data are fitted with a linear failure envelope
        
        
          (Figure 2a), the correlation coefficients are satisfactory (R
        
        
          2
        
        
          >
        
        
          0.92) but the resulting φ’
        
        
          R
        
        
          values are even by 30% lower than