258
Proceedings of the 18
th
International Conference on Soil Mechanics and Geotechnical Engineering, Paris 2013
Proceedings of the 18
th
International Conference on Soil Mechanics and Geotechnical Engineering, Paris 2013
because the plastic strain increment does not related to the stress
increment as described before. The result of the proposed model
describes properly the strain rate effects known experimentally.
Figure 7 shows the results of (a) creep behavior after loading
with constant stress rate, and (b) stress relaxation behavior after
loading with constant strain rate (loading processes are
indicated in the interpolated diagram in each figure). Figure 8
shows the computed
e
-logt relation of conventional oedometer
test by 1D soil-water coupled finite element analysis. Here,
0
is
the initial stress, and
is the instantaneous stress increment.
It can be seen that the three models describe the well-known
consolidation behavior of normally consolidated clay including
the secondary compression.
4.2
Analysis of over consolidated clay and naturally
deposited clay by the proposed model
The non-satoionary flow surface model and the over-sress type
model described in the above section are applicable to normally
consolidated soil alone. On the ther hand, as can be seen from
the derivaton process, the proposed model is valid for over
consolidated soil and structured soil as well. In this subsection,
some applications of the poposed model to over consolidated
clay and structured clay are shown.
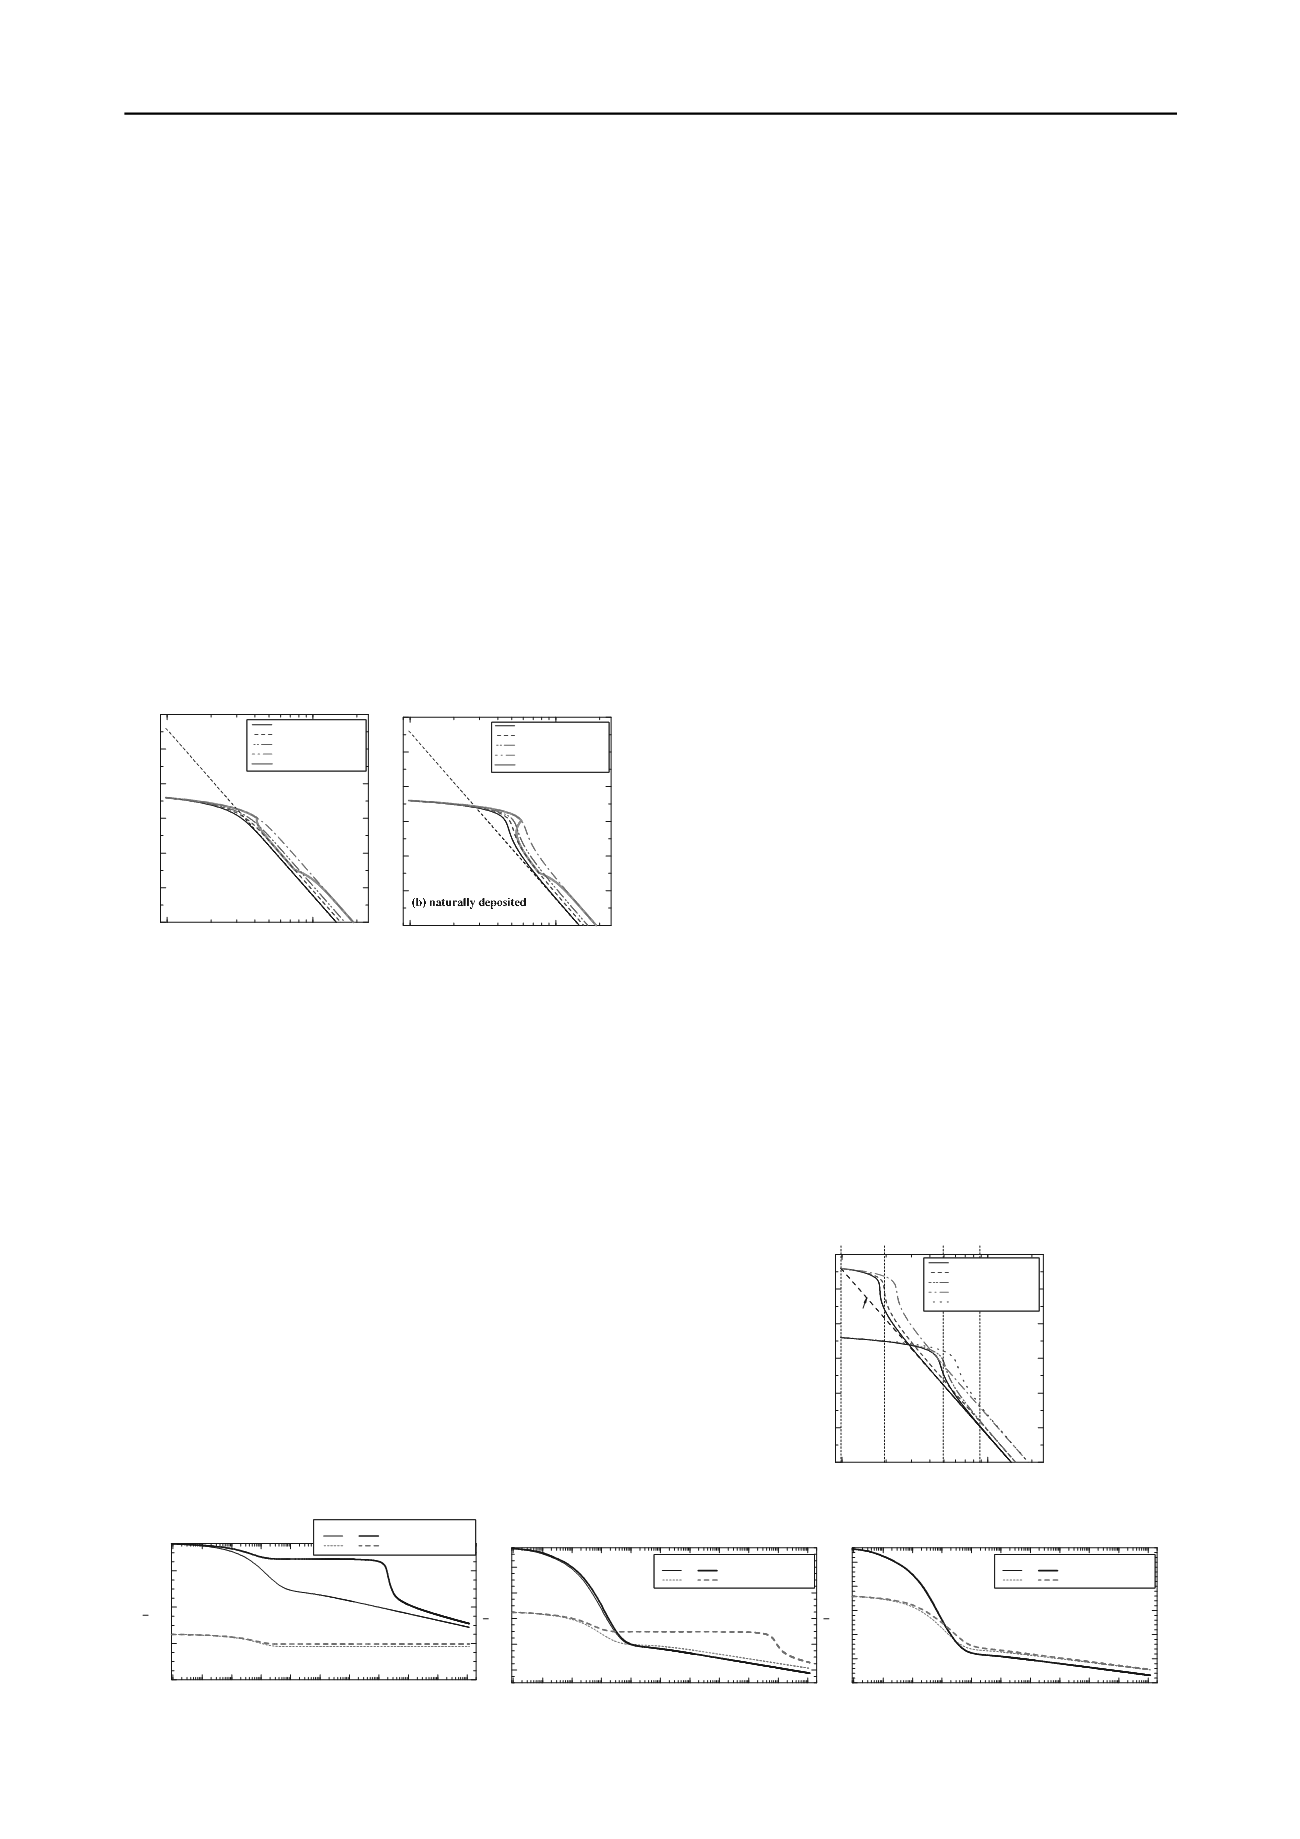
Figure 9 shows the results of one-dimensional compression
behavior of these clays in the same way as Figure 6. It can be
seen that the present model describe well the typical feature of
e
-ln
relation for these clays and the time effect such that the
quasi-yield stress becomes large with increasing strain rate and
the phenomenon of isotache. Figure 10 shows the computed
results of oedometer tests on non-structured (
0
=0.0) and
structured (
0
=0.20) clays with two kinds of initial void ratios
(
0
=0.0 and 0.10), arranged with the same manner as Figure 8.
Here, thin curves and thick curves indicate ones without
bonding (
0
=0.0) and ones with bonding (
0
=0.20). Diagrams
(a), (b) and (c) shows the results of the ratio of stress increment
to initial stress:
/
0
=1, 4 and 8, respectively. It is seen from
diagrams (a) and (b) that although the behavior of the normally
consolidated structured clay (
0
=0.0) is different from that of
the normally consolidated non-structured clay under small stress
increment (
/
0
=1), there is not much difference between
them under large stress increment (
/
0
=4). On the other
hand, the behavior of over consolidated clays (
0
=0.10) is
highly influenced by the effect of structure (bonding) not under
small stress increment but under large stress increment. It is also
seen that from diagram (c) that when the stress increment is
extremely large (
/
0
=8), there is not much difference
between non-structured clay and structured clay regardless of
the initial void ratio. Figure 11 shows the stress strain relation
of these structured clays under large and small strain rate. The
delayed settlements of structured clays may occur when the
quasi-yield stress, which becomes small with decreasing strain
rate, moves through the stress of the corresponding element
(indicated by vertical dotted lines).
5 CONCLUSIONS
The feature of the ordinary viscoplastic models for clay are
explained in 1D condition for easy understanding. A new
approach to model without using ordinary viscoplasticiy is also
shown. The new model is applicable not only to normally
consolidated soil but also to over consolidated soil and naturally
deposited soil. The applicabity of these models are discussed
through the simulations of various time-dependent behavior of
clays. Using the
t
ij
concept (Nakai and Mihara 1984), the
present 1D model can be extended to 3D one (see Nakai et al.
2011b, Nakai 2012).
6 REFERENCES
Adachi T. and Oka F. 1982. Constitutive equation for normally
consolidated clays based on elasto/viscoplasticity.
Soils and
Foundations
, 22(4), 57-70.
Bjerrum L. 1967. Engineering geology of Norwegian normally
consolidated marine clays as related to settlements of buildings,
Geotechnique
, 17(2), 81-118.
Hashiguchi K. 1980. Constitutive equation of elastoplastic materials
with elasto-plastic transition.
Jour. of Appli. Mech., ASME
, 102(2),
266-272.
Mimura M. and Sekiguchi H. 1985. A review of elasto-viscoplastic
models with particular emphasis on stress-rate effect.
Proc of 20
th
Annual Meeting of JGS
, 1, 403-406 (in Japanese).
Nakai T. and Mihara Y. (1984): A new mechanical quantity for soils
and its application to elastoplastic constitutive models,
Soils and
Foundations
, 24(2), 82-94.
Nakai T., Shahin H.M., Kikumoto M., Kyokawa H., Zhang F. and
Farias, M.M. 2011a: A simple and unified one-dimensional model
to describe various characteristics of soils.
Soils and Foundations
,
51(6), 1129-1148.
Nakai T., Shahin H.M., Kikumoto M., Kyokawa H., Zhang F. and
Farias, M.M. 2011b. A simple and unified three-dimensional model
to describe various characteristics of soil.
Soils and Foundations
,
51(6), 1149-1168.
Nakai T. 2012.
Constitutive Modeling of Geomaterials: Principles and
Applications
. CRC Press.
Perzyna P. 1963. The constitutive equations for rate sensitive plastic
materials,
Quart. Appli. Math.
, 20(4), 321-332.
Sekiguchi H. 1977. Rheological characteristics of clays.
Proc. of 9
th
ICSMFE
, Tokyo, 1, 289-292.
10
2
10
3
0.55
0.6
0.65
0.7
0.75
0.8
0.85
no creep
0.002%/min
0.02%/min
2.0%/min
2.0 - 0.002 - 2.0%/min
Ideal - Drained
e
=0.0030
0
=0.10
0
=0.0
(kPa)
(a)
10
2
10
3
0.55
0.6
0.65
0.7
0.75
0.8
0.85
no creep
0.002%/min
0.02%/min
2.0%/min
2.0 - 0.002 - 2.0%/min
Ideal - Drained
e
=0.0030
0
=0.10
0
=0.20, b=40
(kPa)
Figure 9. Simulations of strain rate effect
10
-3
10
-2
10
-1
1 10 10
2
10
3
10
4
10
5
10
6
10
7
0.68
0.72
0.76
0.8
0
=0.0
0
=0.20
0
=0.000 (OCR=1.00)
0
=0.100 (OCR=2.90)
e
t (min)
H=1cm
=98kPa
=98kPa
=0.0030
b=40
(a)
10
-3
10
-2
10
-1
1 10 10
2
10
3
10
4
10
5
10
6
10
7
0.64
0.68
0.72
0.76
0.8
0
=0.0
0
=0.20
0
=0.000 (OCR=1.00)
0
=0.100 (OCR=2.90)
e
t (min)
H=1cm
=98kPa
=392kPa
=0.0030
b=40
(b)
10
-3
10
-2
10
-1
1 10 10
2
10
3
10
4
10
5
10
6
10
7
0.55
0.6
0.65
0.7
0.75
0.8
0
=0.0
0
=0.20
0
=0.000 (OCR=1.00)
0
=0.100 (OCR=2.90)
e
t (min)
H=1cm
=98kPa
=784kPa
=0.0030
b=40
(c)
Figure 10. Simulations of oedometer tests on non-structured and structured clays with different initial void ratios
10
2
10
3
0.55
0.6
0.65
0.7
0.75
0.8
0.85
e
=0.0030
0
=0.20, b=40
(kPa)
NCL
no creep
0.002%/min(
0
=0.0)
0.002%/min(
0
=0.1)
2.0%/min(
0
=0.0)
2.0%/min(
0
=0.1)
Figure 11. Stress-strain behavior of structured clays


