265
Technical Committee 101 - Session I /
Comité technique 101 - Session I
Proceedings of the 18
th
International Conference on Soil Mechanics and Geotechnical Engineering, Paris 2013
Table 2. Parameters used to fit the model by Randolph & Hope (2004)
to the data at each shear strain level
Property
0.17% 0.33% 0.67% 1.67% 2.67% Peak
b
0
0
0.153
0.505
0.888 1.387
c
26.52
25.55
24.61
23.11
23.53 25.09
d
1.865
1.859
2.163
2.589
2.556 2.309
λ
0.275
0.251
0.244
0.212
0.181 0.225
V
0
18.17
21.08
17.76
14.10
6.81 23.39
V
ref
11.17
11.17
11.17
11.17
11.17 11.17
3.2
Strain level dependence of rate effects
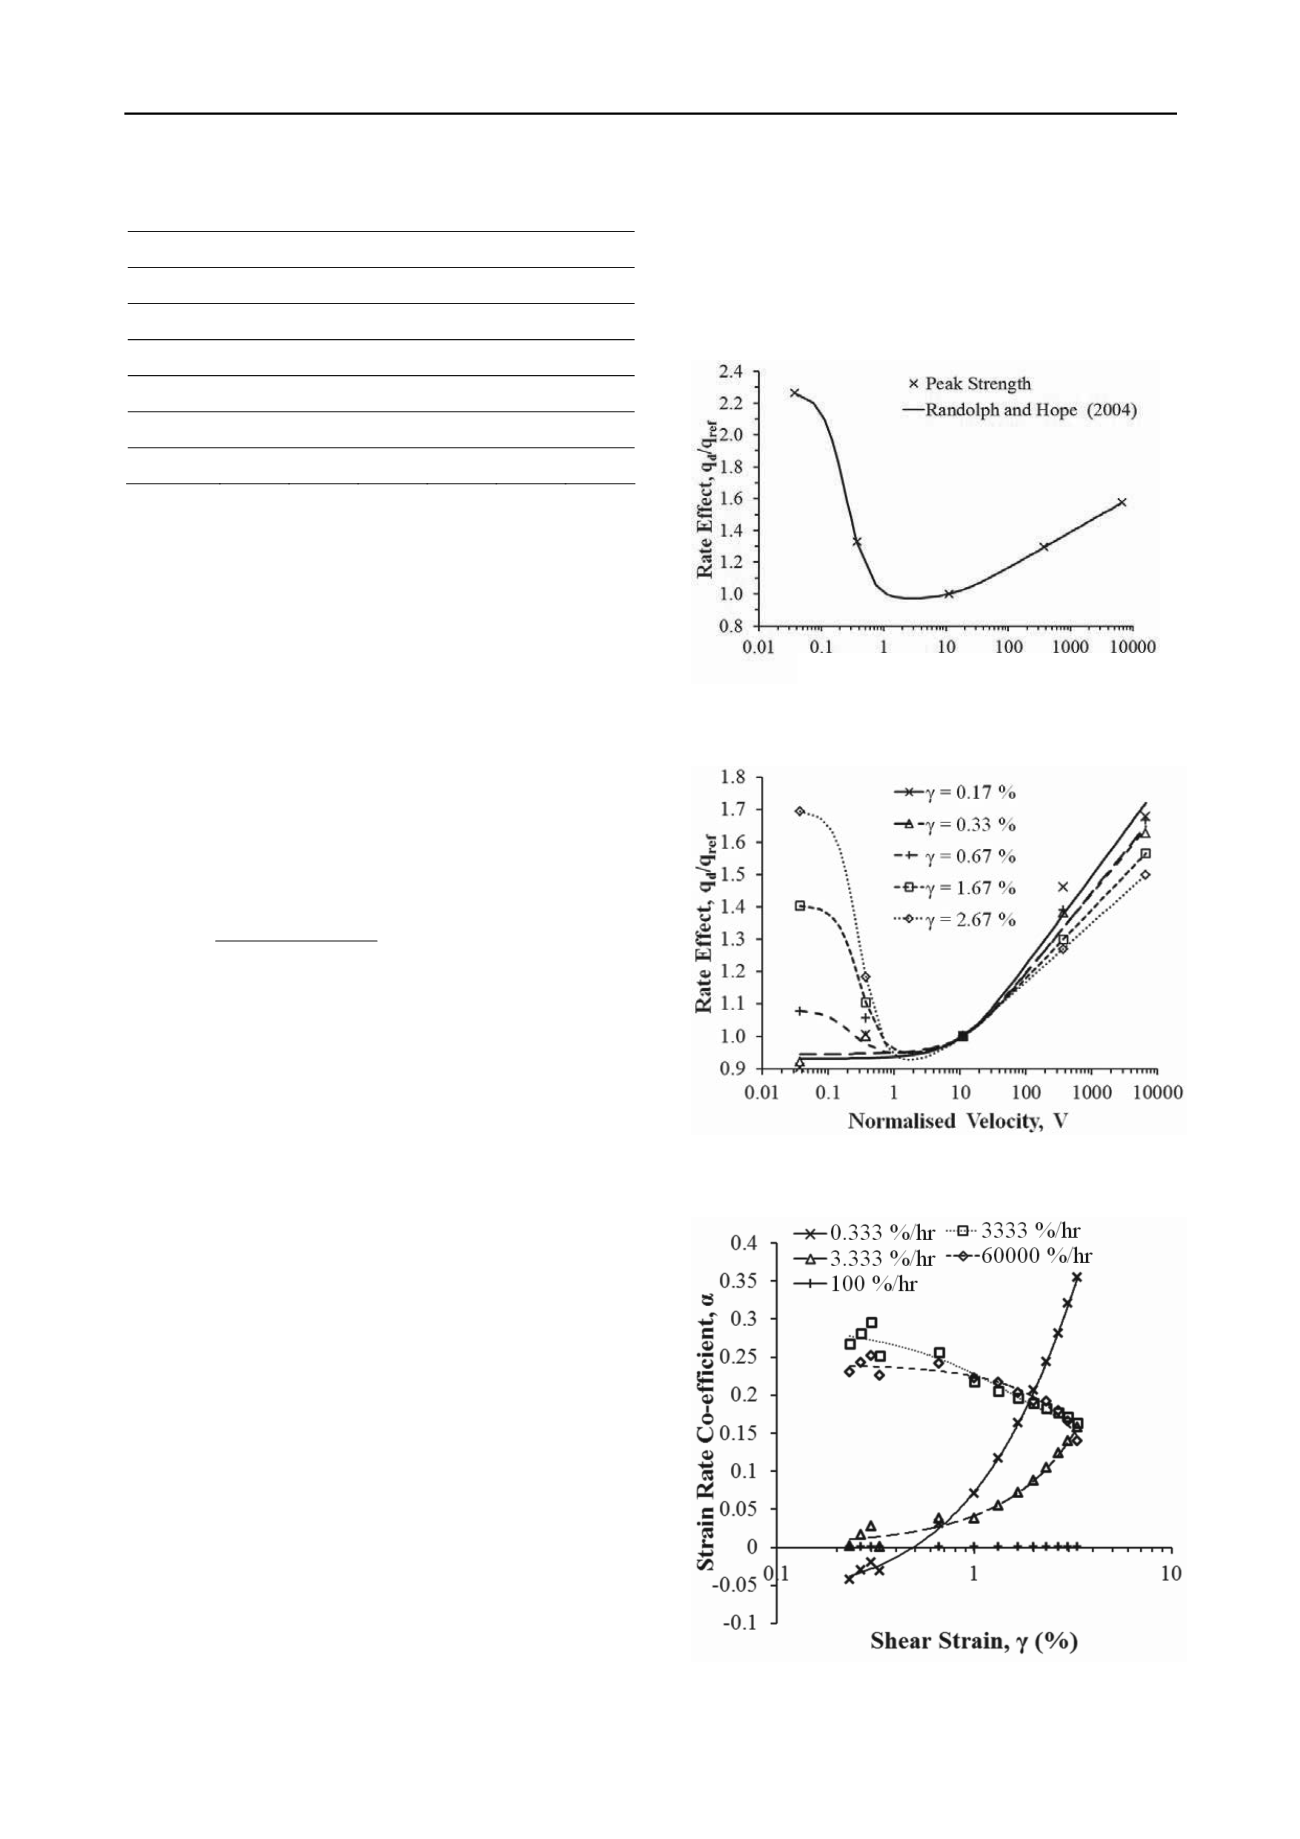
Figure 3 shows that in the partially drained domain rate effects
increase with strain level, which is intuitive as at greater strains
there will be more time for consolidation to occur. Additionally,
at the point at which the transition to undrained behaviour
occurs, the rate effects were found to be relatively independent
of the strain level. Beyond this point the rate effect per log cycle
reduces from 27.5 % at 0.17 % shear strain to 18.1 % at 2.67 %
strain, indicating that undrained rate effects reduce with strain
level, which is important in areas such as rapid load pile testing
(RLT) and assessment of static pile working loads.
Lo Presti et al (1996) developed a method for comparing rate
effects at different shear strain levels by defining a strain rate
coefficient,
α
(Equation 3). This is the change in shear modulus
at a given strain over the log cycle increase in shear strain rate
normalised by the shear modulus at a reference shear strain rate.
)
,( )).
(log(
)(
)(
ref
G
G
(3)
This method was used to further investigate the apparent
dependence of rate effects on strain level. Figure 4 shows the
variation of the strain rate co-efficient,
α
, with shear strain for
the shear strain rates considered. This confirms the earlier
findings that for rates where there is time for consolidation, the
rate effects observed increase with increasing strain. Similarly,
the rate effects reduced with strain for the undrained tests.
However, the graph highlights a significant difference in the
strain rate co-efficient between the partially drained and
undrained tests at extremely small strains.
3.3
Small strain behaviour
To further investigate the effect of strain level on rate effects the
small strain data from the Hall effect transducers was examined.
Figure 5 shows the variation of the shear modulus,
G
, for each
of the rates. Of particular interest is the fact that the initial small
strain shear modulus,
G
0
, appears to vary with shear strain rate,
reducing according to the correlation shown in Figure 6. One
possible explanation for this is that at slower rates, there is more
time for sample drainage at a micro-scale, causing an increase
in the shear modulus at low shear strain rates. However, this
does not explain the increased initial strain rate co-efficient at
low strains in the fast tests.
Figure 7 shows the variation of the elastic shear strain
threshold and this confirms that as found by Mukabi and
Tatsuoka (1999), the elastic shear strain threshold increases
with rate. A best fit was applied to this data and found that for
the soil properties and stress conditions used,
γ
EL
varies as in
equation 4.
γ
EL
= 0.003
0.2
(4)
Considered in conjunction with Figure 5, this shows that at
the initial strain levels considered in Figure 4 (
γ
= 0.2 %), the
faster tests exhibited a greater stiffness than the slower rate
tests, explaining the discrepancy in the initial values of the
strain rate coefficients. This is due to the delay in stiffness
degradation caused by the increase in the elastic shear strain
threshold.
Normalised Velocity, V
Figure 2. Graph of rate effect against normalised velocity at peak
strength with the model by Randolph and Hope (2004) using a
shear strain rate of 100%/hr as the reference rate
Figure 3. Graph of rate effect against normalised velocity at various
shear strain levels shown with the model proposed by Randolph and
Hope (2004)
Figure 4. Graph of strain rate co-efficient against shear strain for
various shear strain rates using a shear strain rate of 100 %/hr as a
reference


