269
Technical Committee 101 - Session I /
Comité technique 101 - Session I
Proceedings of the 18
th
International Conference on Soil Mechanics and Geotechnical Engineering, Paris 2013
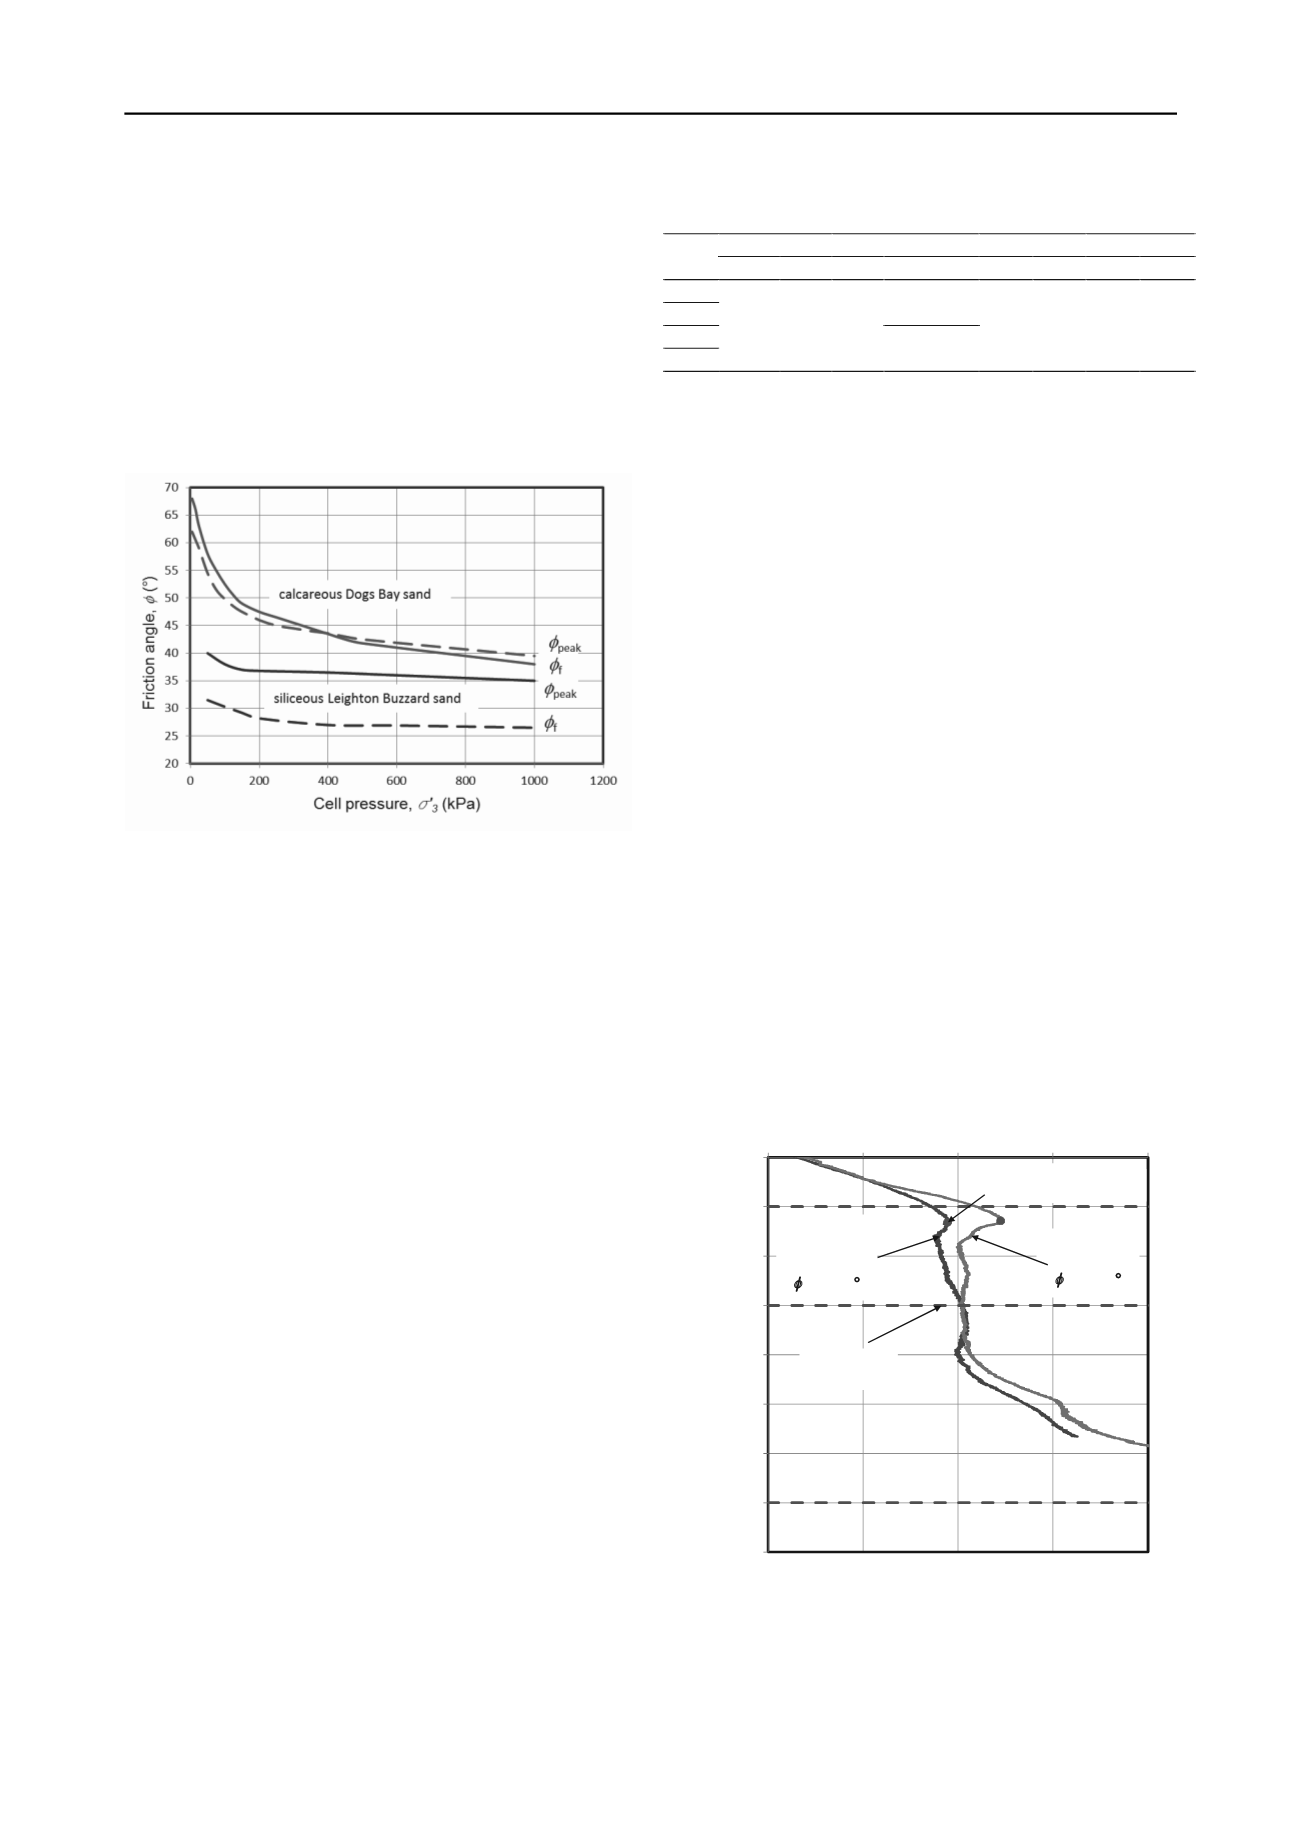
A similar tendency can be found from the experimental
results reported by Desrosiers and Silva (2002). A direct
comparison was made between the behaviour of carbonate sand
from South Australia and silica sand from the United Kingdom.
At steady state shearing, the carbonate sand was already in
contraction under 500 kPa confining stress, while the silica sand
was still in dilation under 1000 kPa. The early transition to
contractive behaviour attributes the fact of particle degradation
of carbonate sand. The low grain hardness caused the grain to
start crushing at relatively low stresses and hindered the
development of potential maximum dilation. This behaviour
agrees well with that observed on the NWS carbonate sand.
Figure 3. Comparison of dilative behaviour between calcareous and
siliceous sand under various cell pressures (Golightly and Hyde 1988).
4 PRACTICAL APPLICATION: SPUDCAN RESPONSE
In order to examine the influence of this disparate characteristic
of carbonate and silica sands on practical applications, model
tests were carried out on spudcan foundations penetrating
through four-layer soils, with a carbonate or silica sand layer
interbedded in soft clay. The experimental program was carried
out at 200 g in a drum centrifuge. The soil was confined within
a purpose designed strongbox to facilitate producing multi-layer
specimens, with the box mounted within the drum channel
(Hossain and Randolph 2012).
Spudcan penetration tests were performed using a half-
spudcan (HS) and a full-spudcan (FS) model of 60 mm (12 m
prototype) diameter. The models were made from duraluminium
and included a 13
shallow conical underside profile (included
angle of 154
) and a 76
protruding spigot. The half-spudcan
was designed to penetrate adjacent to the strongbox window,
permitting the soil deformation to be captured by a camera.
Separate full-spudcan penetration tests were performed away
from the edges of the box to measure the load-penetration
response, avoiding frictional resistance from the window.
Table 2 provides a summary of all centrifuge tests reported.
Four tests encompassed two different four-layer profiles: (i) soft
clay-carbonate sand-soft clay-stiff clay; (ii) soft clay-silica
sand-soft clay-stiff clay. These multi-layer clay samples were
prepared off the centrifuge. Two samples of uniform strength
were prepared by consolidating thoroughly mixed, and then de-
aired, kaolin slurry at 1 g in separate cells. Two different final
pressures were used to obtain comparatively strong and soft
samples. Each clay layer, as detailed in Table 2, was then cut to
size of the strongbox. The bottom two (3
rd
and 4
th
) clay layers
were amassed in the strongbox. A layer of water was poured
into the strongbox. Dry super fine silica sand (or carbonate
sand) was then air-pluviated into the strongbox on top of the
placed lower layers. A loose to medium dense layer was
deposited by raining the sand maintaining a relatively small
sand drop height of about 100 mm. The sand surface was
carefully levelled and the top clay layer was placed.
Table 2. Summary of centrifuge tests reported (
D
= 12 m).
Layer 1
Layer 2
Layer 3
Layer 4
Test
t
1
/
D
Soil
t
2
/
D
Soil
t
3
/
D
Soil
t
4
/
D
Soil
FS1
HS1
Carbonate
sand
FS2
HS2
0.25 Soft
clay 0.5
Silica
sand
0.96 Soft
clay 0.33 Stiff
clay
Commercially available kaolin clay and super fine silica
sand are commonly used for centrifuge model tests at UWA and
an abundance of reliable data exists regarding the geotechnical
properties (e.g. Stewart 1992, Cheong 2002). The carbonate
sand was dredged directly from the North-West Shelf of
Australia, as discussed previously. The critical state friction
angles of the silica and carbonate sands were 34
and 40
,
respectively.
The densities of the sand layers, which were determined by
measuring the total added sand weight and the volume formed
for all cases, corresponded to an average relative density,
I
D
, of
44%. For the clay beds, characterisation tests were carried out
using a T-bar penetrometer, of diameter 5 mm and length
20 mm (model scale).
Figures 4 and 5 show the results from full-spudcan and half-
spudcan tests, respectively. The load-penetration responses (see
Figure 4) are presented in terms of ultimate bearing pressure,
q
u
=
P
/
A
(where
P
is the penetration resistance and
A
is the largest
plan area of the spudcan), as a function of normalised
penetration depth,
d
/
D
. The potential for punch-through failure,
with a local maximum in penetration resistance followed by
some reduction, occurred for all cases investigated. The severity
of failure is conventionally quantified by (a) the degree of post-
peak reduction in resistance and (b) the ‘additional penetration’
before the peak resistance is re-established. By comparing the
penetration resistance profiles for Test FS1 and Test FS2, on
identical soil profiles with identical sand relative density, the
measures of punch-through severity were significantly higher
for the sandwiched silica sand despite its lower friction angle
(
crit
= 34
compared to 40
). This is due to the behaviour of
carbonate sand, as discussed previously and also described
below.
0
0.25
0.5
0.75
1
1.25
1.5
1.75
2
0
100
200
300
400
Normalised penetration depth,
d
/
D
Vertical bearing pressure,
q
u
(kPa)
Soft clay
Soft clay
Carbonate
sand
I
D
= 38%;
crit
= 40
Silica sand
I
D
= 38%;
crit
= 34
Stiff clay
Punch-
through
Layer
interface
Figure 4. Effect of interbedded sand mineralogy on load penetration
response: severity of punch-through (Tests FS1 and FS2, Table 2).
The accompanying soil deformation patterns are shown in
Figure 5 by means of contours of the incremental absolute soil
flow velocity
v
normalised by the foundation speed
v
spud
. The
ratio
v
/
v
spud
of unity indicates that the soil moves with a speed


