277
Technical Committee 101 - Session I /
Comité technique 101 - Session I
Proceedings of the 18
th
International Conference on Soil Mechanics and Geotechnical Engineering, Paris 2013
Figure 4) states that there is continuity of response of bioclastic
and silica sands in their consolidation behaviour, with the initial
void ratio as the controlling factor that differs only because of
the increased grain angularity of the bioclastic soil. Crushing is
therefore not perceived as a consequence of the mineralogy, but
as a consequence of the higher stress concentrations at fewer
interparticle contacts.
Figure 4. Schematic representation of the generalised compression
behaviour of bioclastic and silica sands: virgin compression occurs in a
diffuse band (Semple 1988).
In large-scale model testing, calibration chambers are filled with
a homogeneous sand mass by pluvial deposition using a hopper
and upward moving diffuser sieves. For calcareous sands this
method has proved not useful (Nutt 1993), due to the
irregularity of the grain shapes and the dependence of the
method on a fluent sand rain for a homogeneous density. A
small-scale variant of this method is therefore certainly not
possible as a means of sample preparation.
Therefore, for the on-going study on crushable sand,
homogeneous samples are prepared at the desired void ratio by
sideways hammerblows using a small surcharge to avoid
segregation. For triaxial specimen – where there are no
sidewalls to blow against – satisfying homogeneity is obtained
by pouring and tamping the sample in layers in accordance with
the undercompaction method introduced by Ladd (1978).
In laboratory testing, not all densities can be obtained for
crushable sand samples. A relative density of
D
r
= 60% seems
both practical in the lab and relevant on site after deposition.
Higher densities are hard to come by without crushing, lower
values result in both structural collapse (obscuring the
progression of the test) and irreproducible samples - two sand
samples at the same high void ratio can have a different
structure.
Especially when saturating the samples with water by means of
flushing, a careful approach must assure that the grain structure
remains intact. At low stresses this is of particular importance,
since at low stress the sand structure is the controlling parameter
of its behaviour.
Bioclastic sand samples contain the skeletal remains of marine
organisms. Many of these shells are hollow, but in their
complete state a high capillarity initially prevents water from
penetrating the shells and reaching the enclosed “intraparticle
voids”. Yet, upon crushing of the particles the voids open up,
introducing air in the once saturated sample. For S2-sand, the
different specific gravities from pycnometer tests on complete
sand grains and on grinded powder (
s,grains
= 2.82 Mg/m³,
s,powder
= 2.88 Mg/m³) are indicative of the amount of pores
enclosed within the shells (2.4% on average).
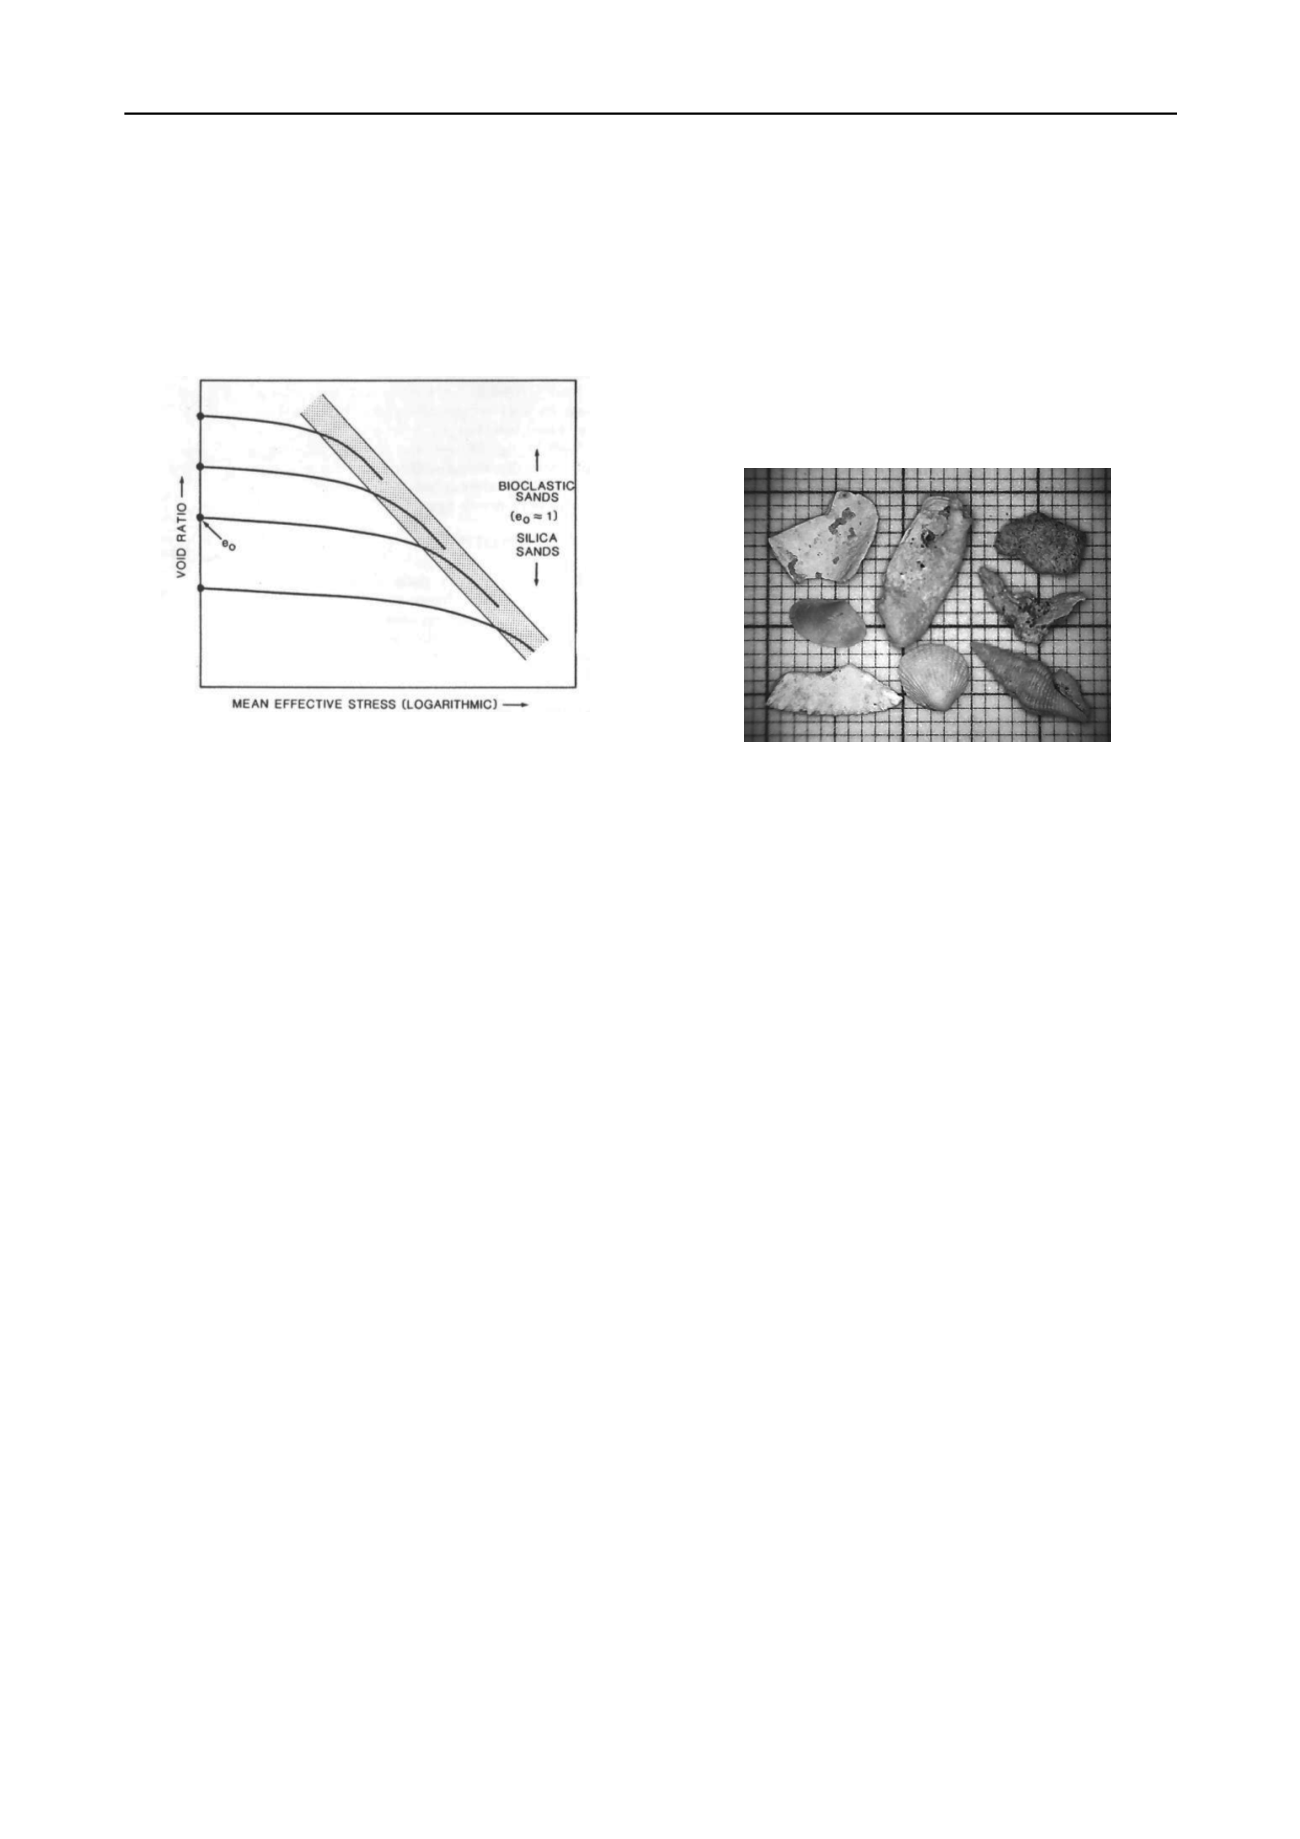
Regarding the dimensions of small-scale test set-ups for
calcareous sand, it is difficult to follow standard recommended
ratios. For example, according to the ASTM D2435 standard for
one-dimensional consolidation tests, the minimum initial height
of the oedometer specimen shall not be less than ten times the
maximum particle diameter. However, due to calcareous
particles often being quite elongated, a presieved sample whose
particles all passed the sieve with aperture size 4 mm will still
contain particles measuring 10 mm and more, as is
demonstrated in Figure 5. Although in this case a
40 mm
mould would satisfy the dimensional requirements that were
formulated in the standard, such a mould might influence the
calcareous sand matrix beyond what is the case for more
rounded sand particles.
Figure 5. Sieved S2-sand particles with D < 4 mm. From placement on
millimeter-paper, it is clear that they have dimensions exceeding 4 mm.
3 INTERPRETATION OF LABORATORY TEST DATA
Sieving is an essential part of the research on crushable sands.
Every test is accompanied by two sievings: one before and one
after the test. From the shift in the granulometric distribution,
the degree of crushing that occurred during the test is quantified
by means of a certain “breakage factor”, aiding the
interpretation of the test data.
An alternative to sieving beforehand, is to assemble virgin
samples following a preset granulometric distribution. Thus,
there is no need to take statistical granulometrical variances into
account, as the smallest shift in the grain size distribution will
unquestionably indicate crushing. Additionally, when
specimens share the same initial granulometry they have
identical “breakage potential”, defined by Hardin (1985) as the
area above the virgin granulometric curve. This renders
comparison of Hardin’s “total breakage” after the test (the
difference between the areas above the curve before and after
testing) more straightforward, with Hardin’s “relative breakage
factor” (the ratio between the total breakage and the breakage
potential) reserved for comparing different sands.
Such manual assembly of a sample is however not feasible for
larger samples. Moreover, after testing of a large sample, only a
small portion can be sieved, lest the sieves get clogged. How
and where within the large specimen a representative sample
must be taken depends on the interest of the research and the
kind of test (e.g. after shearing in a shear box, one might want to
sample near the shear plane whereas this wouldn’t normally be
achievable after a triaxial test; after vibratory table densification
of sand, segregation has taken place within the mould, etc.).
After testing S2-sand under loads in the order of 1 – 8 MPa,
recovering of the sand from the mould is problematic because of
an apparent cementation. The only way to empty the mould
without further damaging the sand is by wetting the sample,
thus weakening the particle bonds. After drying the sample in
the oven at 105°C, the sand mass is covered in a thin cemented
crust made of salt crystals, sticking the small particles together
(Figure 6a). Before sieving, the agglomerates must therefore be
manually broken into separate particles (Figure 6b), otherwise
they would create the illusion of larger particles. On the other
hand, the impression of crushing would be formed when fine


