286
Proceedings of the 18
th
International Conference on Soil Mechanics and Geotechnical Engineering, Paris 2013
Proceedings of the 18
th
International Conference on Soil Mechanics and Geotechnical Engineering, Paris 2013
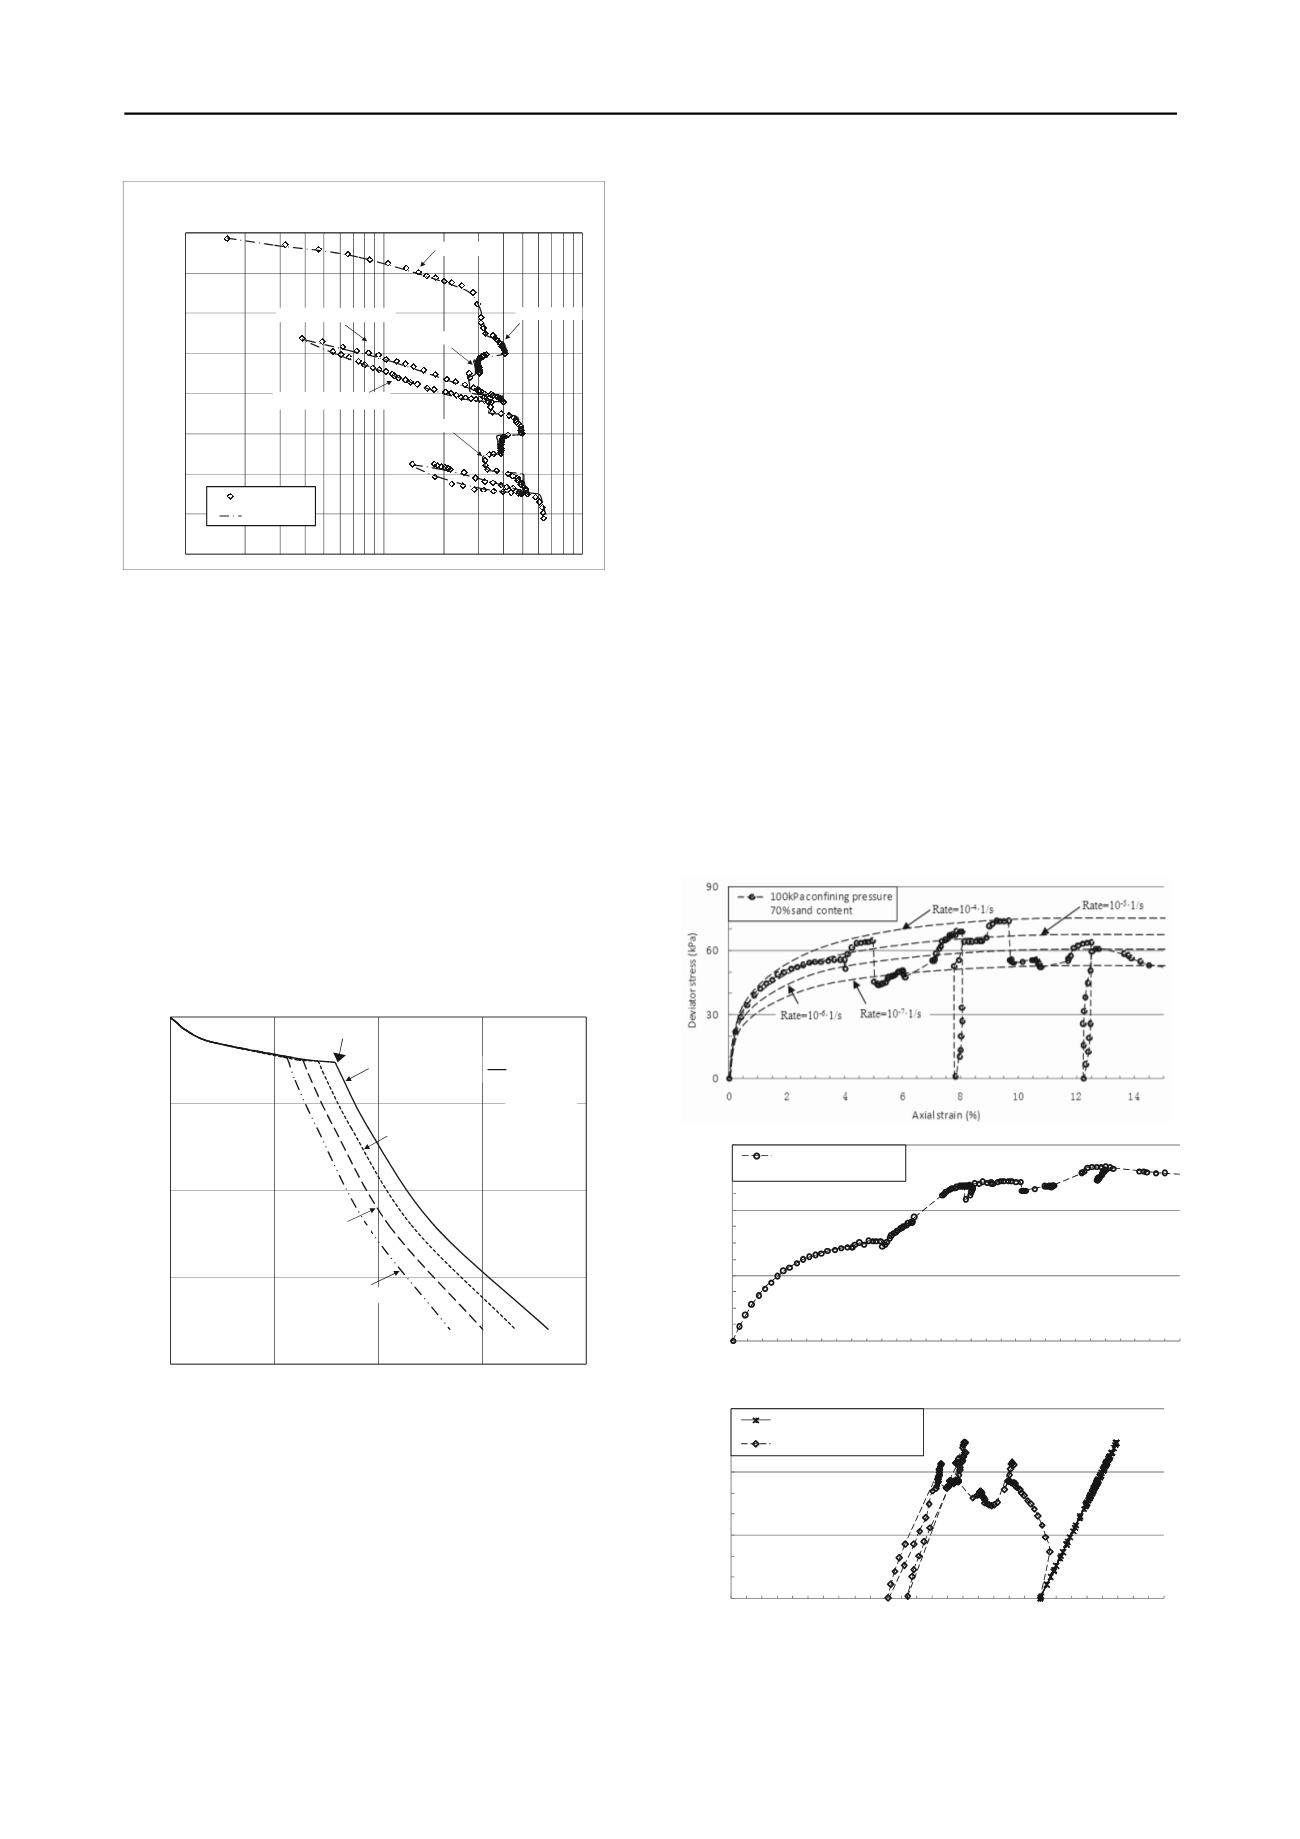
4. CONSOLIDATED UNDRAINED TRIAXICAL
CONPRESSION TESTS ON BENTONITE MIXED
WITH SAND AND RESULTS
The authors have done consoldated undrained triaixal tests on
the same bentonite mixted with different ratios of silicon sand
with effective confining pressure of 50 kPa, 100 kPa and
200 kPa. Curves of (a) deviator stress versus axial strain, (b) the
excess porewater pressure versus axial strain, and (c) the
deviator stress versus effective (or total) mean stress of a CU
test on bentonite mixed with 70% of sand and effective cell
pressure of 100 kPa are shown in Figure 6. It is seen from
Figure 6 that the effects of strain rates are very significant. The
unloading-reloading loops are also evident.
Figure 5. Simulation for strain rate dependent stress-strain behavior in
CSR tests using the EVPS model
5. CONCLUSIONS
From the above presentation and study, the following
conclusions can be drawn:
(a) The stress-strain behavior of a bentonite mixed with
different percentages of silicon sand exhibits strong
dependence on time and strain rate.
(b) Creep, swelling, relaxation and strain effects are clearly
observed and are significant.
(c) In 1D straining condition, there exists a creep region with
stress-strain state closer to the normal consolidaition line
(NCL) and a swelling region far awar from the NCL.
(d) The 1D EVPS model can re-produce well the time-
dependent stress-strain behavior of the soil including creep,
swelling, strain effects, relaxation, and unloading-reloading
loops in 1D straining condition.
0
2
4
6
8
10
12
14
16
1
10
100
VerticalStrain, ε
z
(%)
Vertical effectivestress (log scale), σ’
z
(kPa)
(e) The data from 2D consolidated undrained triaxial
compression tests on the bentonite-sand mixure also show
the strain effects and unloading-reloading loops.
6. ACKNOWLEDGEMENTS
Financial supports (G-U663 and G-YG60) by The Hong Kong
Polytechnic University are acknowledged.
7. REFERENCES
Yin, J.-H. and Graham, J. 1989. Visco-elastic-plastic modeling of one-
dimensional time-dependent behaviour of clays. Canadian
Geotechnical Journal, 26(3), 199-209.
Yin, J.-H. and Graham, J. 1994. Equivalent times and one-dimensional
elastic visco-plastic modeling of time-dependent stress-strain
behavior of clays. Canadian Geotechnical Journal, 31(2), 42-52.
Yin, J.-H. and Graham, J. 1999. “Elastic visco-plastic modelling of the
time-dependent stress-strain behavior of soils”. Canadian
Geotechnical Journal, 36(4), 736-745.
Yin, J.-H. and Tong, F. 2011. Constitutive modeling of the time-
dependent stress-strain behaviour of saturated soils exhibiting both
creep and swelling. Canadian Geot. J.l, 48(12), 1870-1885.Gibson
R.E. and Henkel D.J. 1954. Influence of duration of tests at
constant rate of strain on measured “drained” strength.
Géotechnique
4 (1), 6-15.
Tong, F and Yin, JH (2011). "Nonlinear Creep and Swelling Behavior
of Bentonite Mixed with Different Sand Contents under
Oedometric Condition". In the Journal of Marine Georesources
and Geotechnology, Volume 29
,
346~363.
0
5
10
15
20
0
20
40
60
8
Vertical Strain, ε
z
(%)
Vertical effectivestress, σ’
z
(kPa)
0
EVPS Modeling
=10
-5
1/sec
=10
-4
1/sec
=10
-6
1/sec
=10
-7
1/sec
ψ
c
/V=0.00801
ψ
s
/V=0.00704
The preconsolidation pressure increases with strain
0
20
40
60
0
2
4
6
8
10
12
14
Excess porewater pressure (kPa)
Axialstrain (%)
100kPaconfining pressure
70%sand content
0
30
60
90
0
20
40
60
80
100
120
140
Deviatorstress (kPa)
Meanstress (kPa)
TSP 100kPaconfining pressure
ESP 100kPaconfining pressure
Figure 6. (a) Deviator stress
versus
axial strain, (b) the excess
porewater pressure
versus
axial strain, and (c) the deviator stress
versus
effective (or total) mean stress – CU test on bentonite mixed with 70%
of sand and effective cell pressure of 100 kPa
(c)
(a)
(b)
CRS
EVPS Modeling
Rate=10
-5
1/sec
Rate=10
-4
1/sec
Rate=10
-6
1/sec
Rate=10
-7
1/sec
UnloadingRate=10
-5
1/sec
ReloadingRate=10
-5
1/sec
Figure 4. Comparison of modelling results with measured data from
a CRS test with step-changed strain rates and with unloading and
reloading


