281
Technical Committee 101 - Session I /
Comité technique 101 - Session I
Proceedings of the 18
th
International Conference on Soil Mechanics and Geotechnical Engineering, Paris 2013
oaxiality as measured by the deviation
cipal stress direction and the principal
3.2
Non-coaxiality
The degree of non-c
between the major prin
strain increment direction, (
α
d
ε
-
α
σ
) for tests with different stress
ratios are plotted in Figure 4(a) - (d). As elastic strain increment
takes a much smaller proportion in the total strain increment
compared to that of the plastic strain increment (Gutierrez et al.
1991), the total strain increment instead of the plastic strain
increment is used in the following analysis. In general, the
variation trend of the non-coaxiality degree shows an obvious
oscillation during the tests. Lower degrees of non-coaxiality are
observed in the first few cycles. When the rotational shear
continues, the strain increment direction becomes closer to the
stress increment direction and higher degrees of non-coaxiality
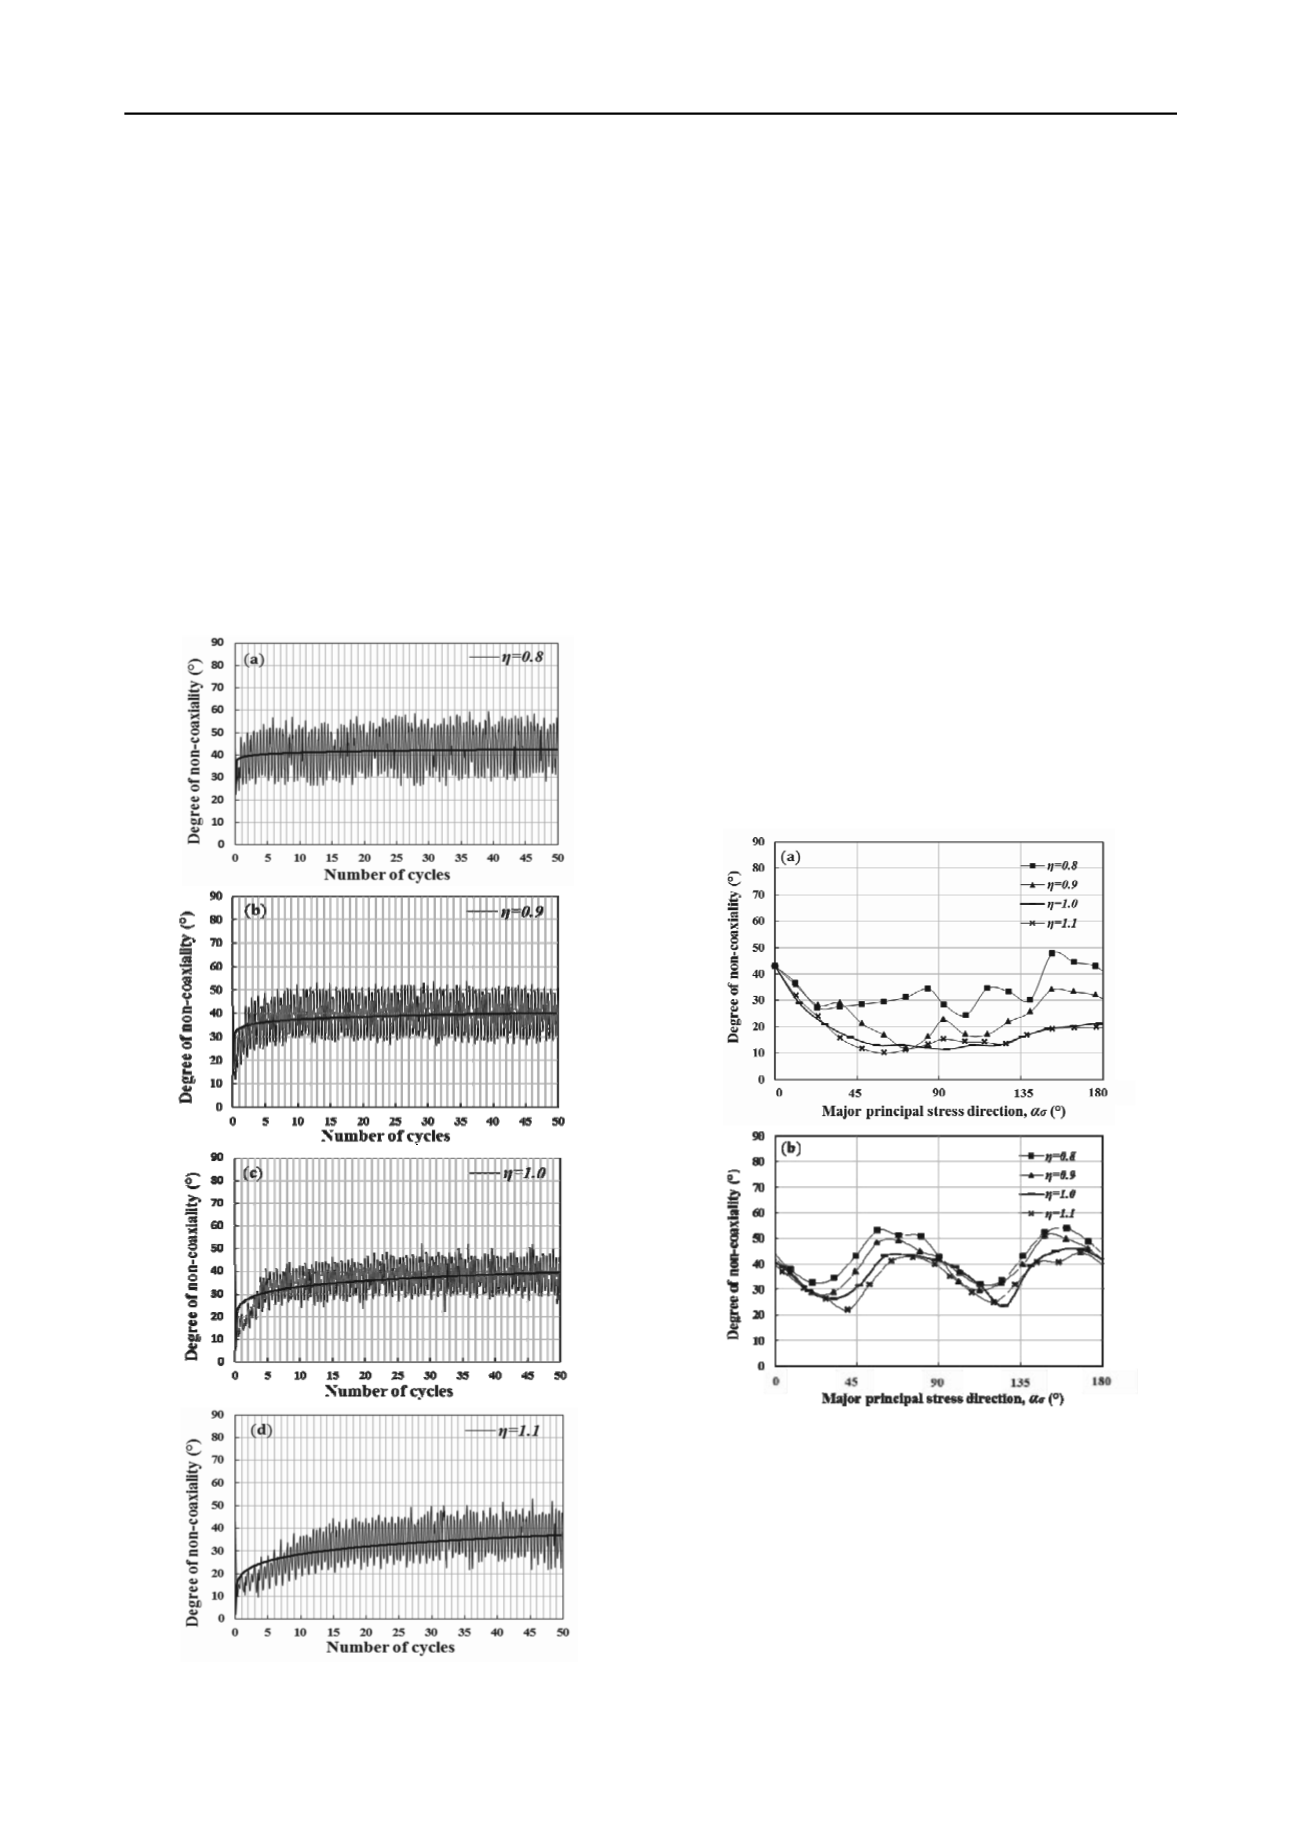
are observed. After about 20 rotation cycles, the variation of the
non-coaxiality degree appeared to be stabilized. It is clear that
the increasing trend of the non-coaxiality degree at the initial
stage is more obvious for tests with higher stress ratios.
Figure 4. Degree of non-coaxiality against number of cycles for test
with: (a)
η
=0.8; (b)
η
=0.9; (c)
η
=1.0; (d)
η
=1.1.
atio (
η
=0.8), (
α
dε
-
α
σ
)
The black solid lines in Figure 4 are the trend lines of the
non-coaxiality degree. With a lower stress r
is closer to 45°, indicating the strain increment direction is
closer to the stress increment direction. At the same number of
cycles, the degree of non-coaxiality decreased with the increase
of the stress ratio. This observation agrees well with the
laboratory results presented by Gutierrez et al. (1991) and
numerical results obtained by Li and Yu (2009) based on DEM
simulations.
As described above, the variation trend of the non-coaxiality
degree shows an obvious periodicity during the tests. To have a
better view, the relationship of the non-coaxiality degree with
the major principal stress direction
α
σ
at the cycle numbers
N
=1
and
N
=20 are presented in Figure 5(a) and 5(b). Figure 6 shows
the corresponding stress paths and strain increments in these
tests. It is clear that the variation of the non-coaxiality degree
differs significantly at the two stages. At the initial stage when
N
=1 the degree of non-coaxiality lies approximately in the
range of 10 to 40°, as shown in Figure 5(a). It tends to decrease
when
α
σ
rotates from 0 to 90° and then increase during the latter
half cycle’s rotation. However, at
N
=20 (Figure 5b), the
fluctuation of the non-coaxial degree exhibits two periods of a
sine wave displaced at 180 degree intervals. Meanwhile, as
mentioned above, the stress ratio has a significant effect on the
non-coaxiality degree. The larger the stress ratio, the lower non-
coaxial degree between the directions of the strain increment
and stress is induced.
Figure 5. Degree of non-coaxiality for rotational shear tests at: (a)
N
=1;
and (b)
N
=20.
crements are gradually enlarged with the increase
As shown in Figure 6, for both
N
=1 and
N
=20, the directions
f the strain in
o
of the stress ratio. It is interesting to see that for
N
=20 the strain
increment differs significantly in different sections. When the
principal stress axes rotate along the stress paths of DA and BC,
which correspond to the major principal stress direction
α
σ
in
ranges of [45°, 90°] and [135°, 180°], the strain increment
direction almost coincides with the stress increment direction.
Similar results have been reported by Tong et al. (2010). For
lower stress ratios such as
η
=0.8 and 0.9 in Figure 6, several
arrows pointed inside the cycle, indicating the strain increment


