284
Proceedings of the 18
th
International Conference on Soil Mechanics and Geotechnical Engineering, Paris 2013
Proceedings of the 18
th
International Conference on Soil Mechanics and Geotechnical Engineering, Paris 2013
staged isotropic loading tests with unloading/reloading and with
creep and swelling, and (ii) step-changed constant rate of strain
consolidated undrained compression tests (CU tests) in triaxial
state. From these test data, creep, swelling, relaxation, and strain
rate effects are investigated and discussed.
Based on the 1D Elastic Visco-Plastic (1D EVP) models
developed by Yin and Graham (1989, 1994, 1999), the authors
have proposed a new 1D Elastic Visco-Plastic model
considering both creep and swelling (called 1D EVPS) (Yin and
Tong 2011). The data from the multi-staged oedometer tests are
used to calibrate the new 1D EVPS model. After this, 1D EVPS
model is used to simulate the step-changed constant rate of
strain compression tests in 1D straining and other types of tests
and make comparisons.
Unloading-reloading loop due to swelling-creep
Normal c
line (NCL)
onsolidation
2. OEDOMETER TESTS ON BENTONITE MIXED WITH
DIFFERENT SAND CONTENTS AND RESULTS
The authors have done a series of oedometer tests on a mixture
of bentone and silicon sand with silicon sand contents of 50%,
60%, 70%, 80% and 90%. Table 1 gives a simmay of basis
properties of the mixtue with 60%, 70%, and 80% (Tong and
Yin 2011).
Table 1 Basic properties for different bentonite-sand mixed samples
Sand proportion
50%
60%
70%
Water Content (%)
211.5
159.0
124.5
Liquid Limit W
L
(%)
146.0
106.0
82.6
Plastic Limit W
P
(%)
29.9
28.7
27.4
Plastic Index I
P
(%)
121.1
77.3
55.2
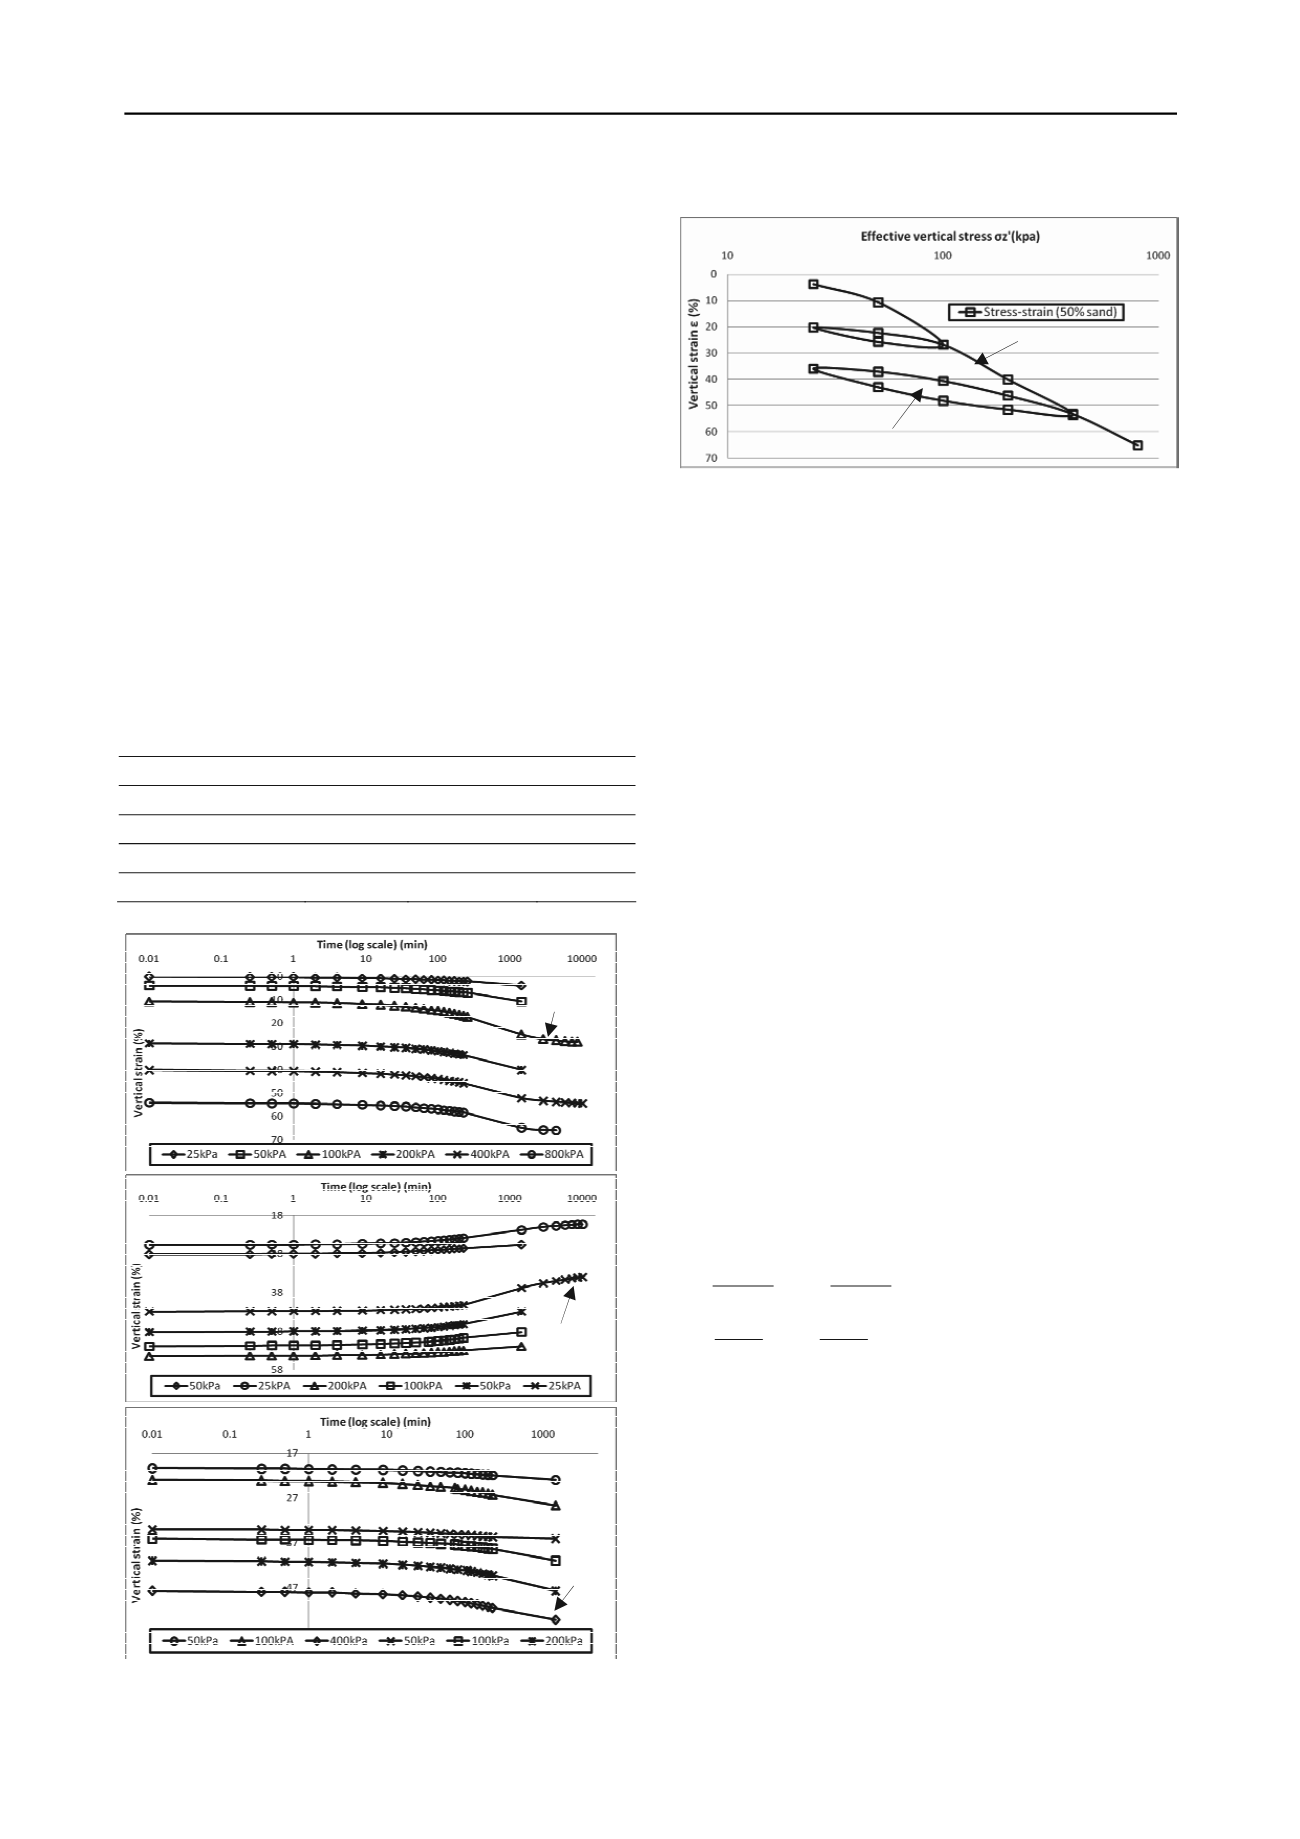
Figure 1. Vertical strain against time in log scale for 50% sand mixed
with 50% bentonite (a) loading, (b) unloading, and (c) reloading
Figure 2. Vertical strain against vertical effective stress in log scale
from tests on bentonite-sand mixture (50% sand content)
The curves of log(time) and vertical strains for a mixture of
50% bentone and 50% sand are shown in Figure 1. The
oedometer test was carried out in stages and with unloading-
reloading.
It is clearly seen from Figure 1(a) and (b) that the mixture
exhibits both time-dependent creep and swelling. It is noted
that “swelling” here is neither the rebound due to unlading, or
the expansion of an unsaturated clay due to absorbing water.
Instead, the “swelling” here is defined expansion of a saturated
clay due to swelling potnetial of the clay udner a constant
vertical effective stress. The “swelling” here is oposite to teh
creep.
Figure 2 shows the curve of vertical strain against vertical
effective stress in log scale from tests on bentonite-sand mixture
(50% sand content) with duration of 24 hours for each loading.
It is seen from the figure that there are two unloading-reloading
loops. The authors belive that the swelling and creep contribute
to the loops. This is because that when the specimen is
unloaded to very stress-strain state far from the normal
consolidaiton line (NCL), the swelling poential of the mixture
has caused the clay to expand and caused the time-depepdeint
reduction of strain. When the specimen is re-loaded to the
stress-strain state closer to the NCL, the mixtuer will have creep
compression. The authors also consider that the partical
movements of the mixture may also contribute to the formation
of the loops.
It is noted that the curves of log(time) and vertical strains
and the curves of vertical strain against vertical effective stress
in log scale of other mixtures are similar to those in Figures 1
and 2. From all test data, the authors have detrmined values of
compression index
C
c
, rebound index
C
r
, creep coefficient
C
�
and swelling coefficient
C
s
. The definitions of those parameters
are:
(1)
Values of
C
c
,
C
r
,
C
�
and
C
s
are presented in Table 1. In Table 1,
the ratio of
c
and
r
s
are also given. The following
ovservations can be obtained grom Table 2:
CC
/
CC
/
Both the compression index
C
c
and recound index
C
r
decrease with the increase of the sand content. This means
that the more the sand content, the less compresssion of the
mixture.
In generally speaking, the creep coefficient
C
�
decreases with
the increase of the sand content. This means that the more the
sand content, the less creep of the mixture. In addition, the
coefficient
C
�
also decreases with the increase of the vertical
effective stress.
In generally speaking, the swelling coefficient
C
s
decreases
with the increase of the sand content. This means that the
more the sand content, the less swelling of the mixture. In
addition, the coefficient
C
s
increases with the decrease of the
vertical effective stress.
(b)
(c)
(a)
Creep
Swelling
Creep
t
e
C
t
e
C
e
C e
C
s
z
r
z
c
log
;
log
log
;
log
'
'


