280
Proceedings of the 18
th
International Conference on Soil Mechanics and Geotechnical Engineering, Paris 2013
Proceedings of the 18
th
International Conference on Soil Mechanics and Geotechnical Engineering, Paris 2013
In this study, the HCA, developed by GDS Instruments Ltd, was
used. For the details of the testing system, see Cai (2010). The
hollow cylindrical specimen had an inner radius of 30 mm,
outer radius of 50 mm and height of 200 mm. As shown in
Figure 1, the loading of the specimen consisted of an axial load
W
, torque
M
T
, inner cell pressure
P
i
and outer cell pressure
P
o
.
The application of these stress components enables the control
of axial stress
σ
z
, radial stress
σ
r
, circumferential stress
σ
θ
, and
shear stress
σ
θz
, on an element in the wall of the hollow
cylindrical specimen.
Since the stresses are not uniformly distributed across the
sample wall especially with unequal inner and outer cell
pressures, it is necessary to compute average values. The
equations used to calculate the average stress and strain
components are listed in Table 1.
Table 1. Equations used to calculate stresses and strains (Hight et al.
1983)
r
o
: outer radius,
r
i
: inner radius,
H
: height of specimen,
w
: axial
displacement,
u
o
: outer radius displacement
u
i
: inner radius
displacement,
θ
: torsional angle.
The major principal stress, intermediate principal stress and
minor principal stress are calculated by using Eqs. (1a)-(1c).
2
2
1
2
2
z
z
z
r
2
2
2
3
2
2
z
z
z
The stress path in drained tests can be characterized by four
independent parameters, namely the mean principal effective
stress
p’
, deviatoric stress
q
, intermediate principal stress
parameter
b
and the angle
α
σ
between the major principal stress
σ
1
and the vertical direction. These parameters are defined in
Eqs. (2a)-(2d).
3
'
3
'
2
'
1
p
2
3
2
2
3
1
2
2
1
)
( )
( )
(
2
1
q
'
3
'
1
'
3
'
2
b
z
z
2
tan
2
1
1
2.2
Sample preparation method
The tests were performed on dense Leighton Buzzard (Fraction
B) sand, with an initial relative density of
D
ri
≈70%. Leighton
Buzzard sand is made up of sub-rounded particles and mainly
composed of quartz. It has a specific gravity of 2.65, mean
particle size of 0.62 mm, minimum void ratio of 0.52 and
maximum void ratio of 0.79 (Cai 2010). The water
sedimentation method was employed to prepare all the samples.
After saturation, with a Skempton's B value greater than 0.96,
specimens were consolidated isotropically under an effective
confining stress of
p’
=200 kPa.
2.3
Stress paths of drained rotational shear tests
The stress paths in
q
-
p’
and deviatoric stress planes are shown
in Figure 2. In the deviatoric stress plane, the vector from the
origin has a length equal to the magnitude of the deviatoric
stress
q
and makes an angle of 2
α
, which is twice the angle of
the major principle stress
σ
1
makes with the vertical direction.
During the tests, the samples were first subjected to monotonic
shearing in the vertical direction up to a specified stress ratio
(
η
=0.8, 0.9, 1.0, 1.1) while keeping the effective mean stress
p’
constant (A→B). After that the principal stress axes were
rotated counter clockwise (B→C→D→E→B) under drained
condition, while keeping the deviatoric stress constant and
maintaining the effective mean stress
p’
=200 kPa and the
intermediate principal stress parameter
b
=0. To ensure full
discharge of water from the specimen, the major principal stress
direction
α
σ
was rotated at a slow rate of 2°/min.
Figure 2. Stress paths for rotational shear test (Nakata et al. 1998).
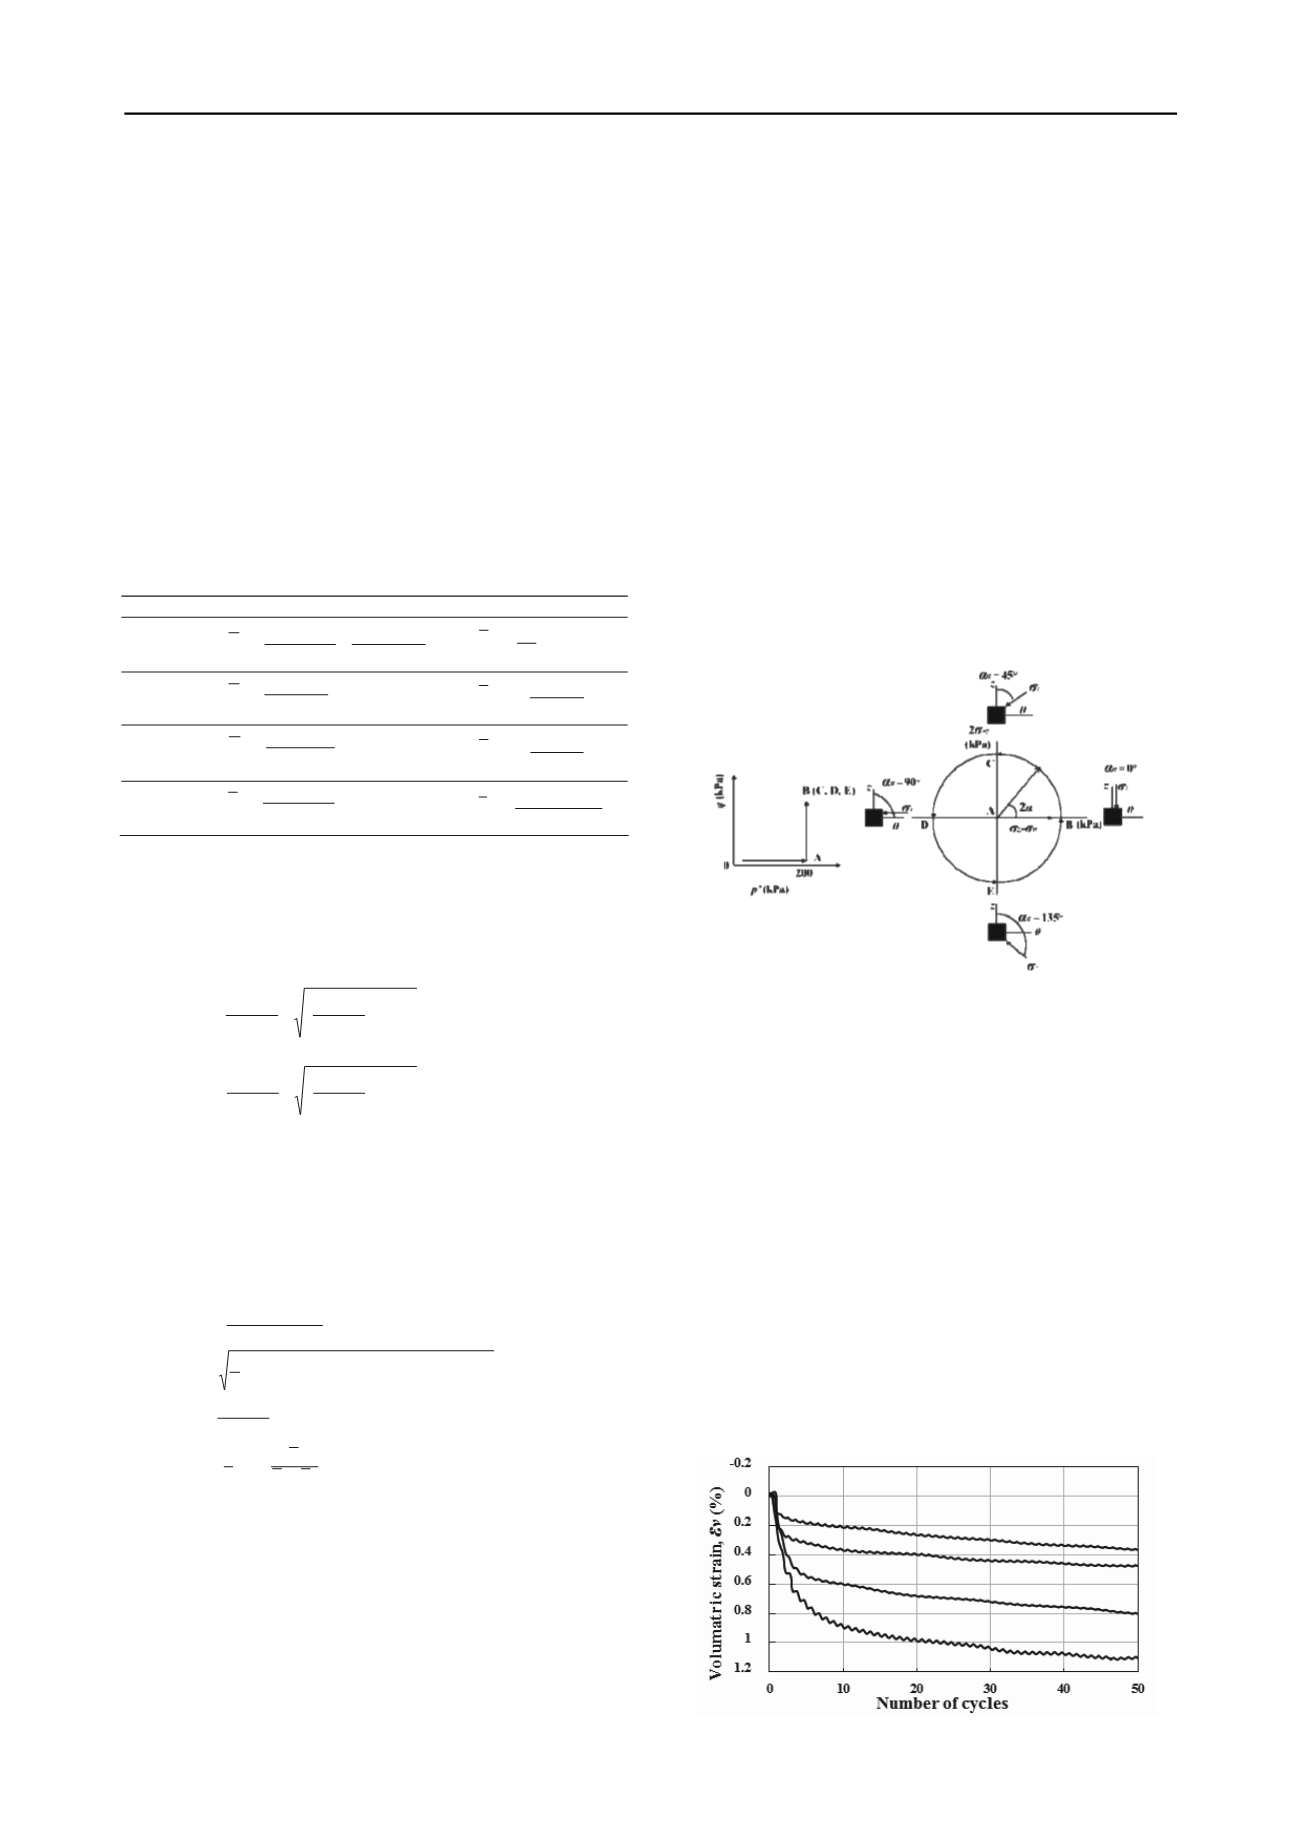
3 TEST RESULTS AND DISCUSSIONS
3.1
Development of volumetric strain
The evolutions of the volumetric strain
ε
v
with the increasing
number of cycles for rotational shear tests are shown in Figure
3. A positive value along the vertical axis indicates contraction
and negative indicates dilation. Although the magnitudes of
principal stresses were maintained constant during each test,
contractive volumetric strain accumulated due to the rotation of
principal stress directions. It can be observed that most of the
volumetric strain occurs during the first few cycles and its
accumulation rate tends to decrease as the number of cycles
increases. It is clear that the effect of stress ratio on the
development of the volumetric strain is significant under
otherwise identical conditions. For all the four tests, the amount
of the contractive volumetric strain at the same number of
cycles increases with the increase in the stress ratio
η
.
Direction
Stress
Strain
Vertical
2
2
2
2
2
2
)
(
i
o
i i
oo
i
o
z
r r
rP rP
r r
W
H
w
z
Circum-
ferential
i
o
i i
oo
r r
rP rP
i
o
i
r r
u u
0
Radial
i
o
i i
oo
r
r r
rP rP
i
o
i
r
r r
u u
0
Shear
)
(2
3
3 3
i
o
T
z
r r
M
)
(3
)
(2
2
2
3
3
i
o
i
o
z
r rH
r r
(1a)
(1b)
(1c)
(2a)
(2b)
(2c)
(2d)
η
=0.8
η
=0.9
η
=1.0
η
=1.1
Figure 3. Stress paths for rotational shear test.


