276
Proceedings of the 18
th
International Conference on Soil Mechanics and Geotechnical Engineering, Paris 2013
Proceedings of the 18
th
International Conference on Soil Mechanics and Geotechnical Engineering, Paris 2013
amplitude reusing the tested sand. It was noticed (as shown in
Figure 1) that the density increased with higher amplitudes,
however for every refill of the mould extra sand was needed,
indicating that there had been erosion indeed. This had gone by
unnoticed in the sand portion from the top because segregation
during vibration had caused the crushed particles to flow
downwards in the mould. When the entire
3.5 kg sand mass
was mixed and representative portions of 120 g were taken and
sieved, crushing was eventually evidenced (Figure 2).
11
12
13
14
15
7,5
8
8,5
Unit weight (kN/m³)
Amplitude
final high density
low initial density
minimum density
Figure 1. Vibratory table densification of S1-sand: Reusing the same
sand causes crushing, which increases both minimum and maximum
density. Note: The dimensionless “amplitudes” in this figure simply
denote the positions (on a scale of 10) on the rheostat controlling the
force of vibration, they are not the actual amplitudes.
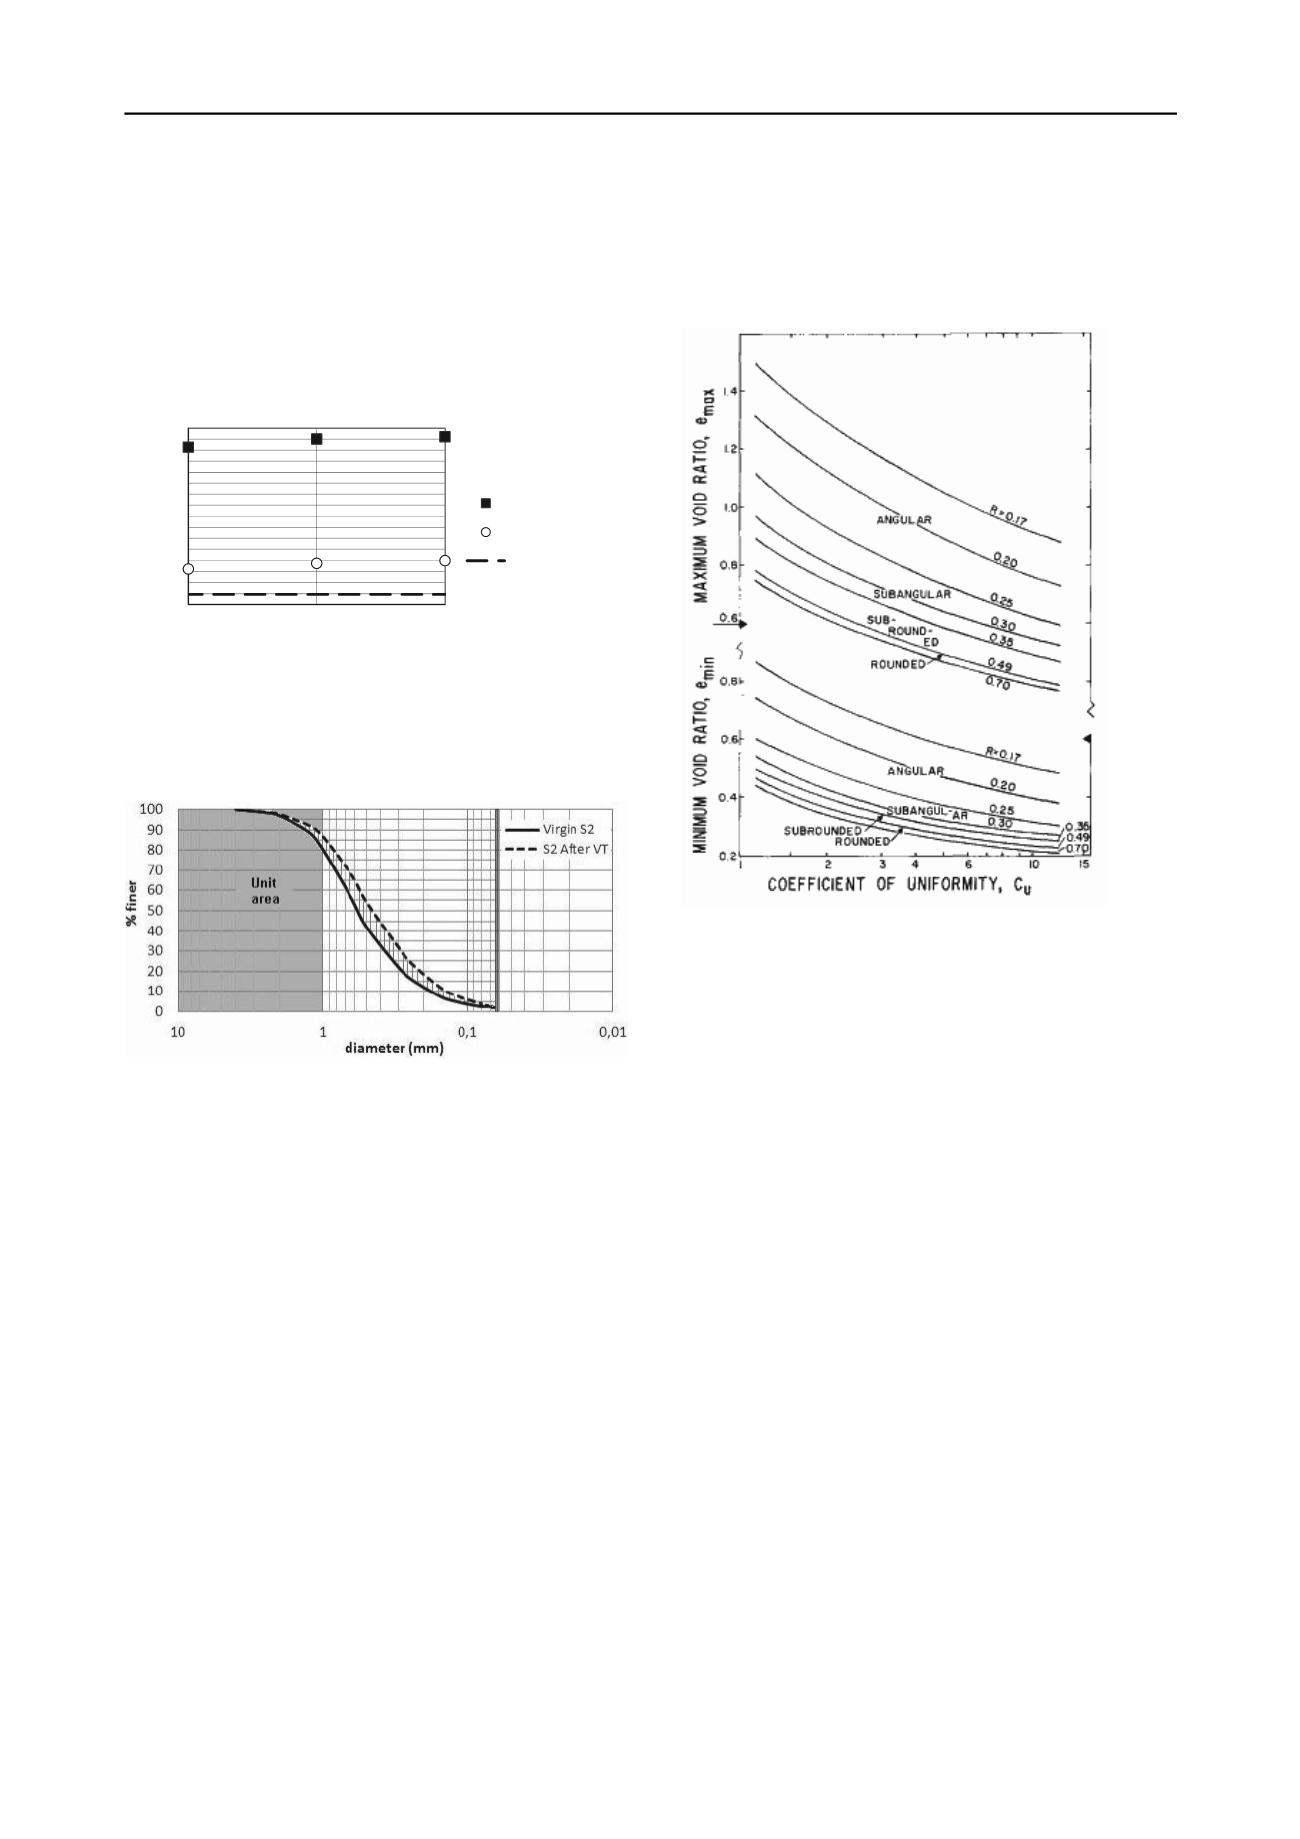
Figure 2. The granulometric distribution of S2-sand before and after
vibratory table test at “amplitude” 6.5. Crushing can be quantified by
Hardin’s relative breakage factor, here
B
r
= 0.1 (see below).
High amplitude shaking causes crushing of the calcareous sand
particles, altering the sand and leading to an ever increasing
minimum and maximum density, the increase being greater with
increasing amplitude. It is important to define single correct
lower and upper values of the density in calculations of the
relative density since the definition of
D
r
= (
e
max
-
e
)/(
e
max
-
e
min
) x
100 – a ratio of two small numbers – makes it vulnerable to
errors. Moreover,
e
min
should be obtained without crushing since
the interpretation of any geotechnical test on crushable sand is
accompanied by the degree of crushing during the test, and
during the test only; any crushing that occurs during preparation
of the sample at a certain density is unwanted.
To some extent however, there is always a change in grain size
distribution when handling crushable sands. Youd (1973) offers
two determining factors by stating that a test has caused “no
crushing” when the increase of particles passing the N°200
sieve (63 µm) is less than 1.5% of the total specimen weight,
and the maximum increase of particles passing any sieve is less
than 2%.
Still, even when there is no discernible change in grain size
distribution, the densification process causes breaking of
asperities of the angular sand grains. Particles become more
rounded and very small dust particles are released. Both effects
leave the granulometric distribution unchanged: the diameter
(intermediate dimension) of a polished particle is still as before,
and the fines lack substance to appear in the sieve fractions
(especially when weighted with the total sample mass) or they
get lost due to the electrostatic effect during dry sieving. Yet
these small morphological and granulometrical alterations do
affect the structure and the packing (Figure 3) – and hence the
behaviour of the sand to a considerable degree.
Figure 3. Gradation and particle shape control the possible packing
configuration of sand (Youd 1973).
The ASTM D4253 notes that the sides of the mould may be
struck a few times using a rubber hammer “to settle the soil so
that the surcharge base plate can be easily placed into position
and there is no surge of air from the mold when vibration is
initiated”. Although the amount and intensity of the
hammerblows is not specified, a few (e.g. 3) strikes in small-
scale densification tests on calcareous sand already prove
effective for further densification. The impact of the hammer
causes the initially unstable sand structure (with its many
“bridges”) to collapse into a more stable configuration that
allows further settlement by vibration rather easily and without
crushing. The standard method to obtain the maximum density
of a sand according to the Japanese Geotechnical Society (1992)
is based on this idea of densification by shear stress: a
40 mm
mould is filled with sand in 10 layers. After pouring each layer,
the mould is impacted sideways with 100 hammerblows. Some
questions remain with this method: the boundaries of the small
mould affect the densification process and the obtained
maximum density value, and the absence of a top plate enables
segregation of the sand grains.
The intent of the formulation of relative density
D
r
is to
evaluate the potential for the assembly of sand particles to form
a compressible structure. Yet when the maximum density
increases due to crushing, the upper limit in
D
r
changes. The
particular compaction behaviour of crushable sands (being
totally different from that of silica sands) might call for a
reviewed test method for
e
min
. Most papers disregard this
problem of a correct determination of
D
r
of crushable soils. At
best they urge to keep in mind that the real
D
r
-value can differ
from the laboratory one, when using it for engineering purposes.
Mostly the problem is avoided by using the natural void ratio
e
0
as the primary variable and potential index to compressibility,
without relating it to
e
max
and
e
min
. For example Semple (1988,


