285
Technical Committee 101 - Session I /
Comité technique 101 - Session I
Proceedings of the 18
th
International Conference on Soil Mechanics and Geotechnical Engineering, Paris 2013
The ratios of C
α
/ C
c
and C
s
/ C
c
also decrease with the sand
content.
Table 2 Creep and swelling indexes for different bentonite samples
Sand proportion
50%
60%
70%
80%
90%
Compression index
C
c
0.315 0.296
0.260
0.243
0.104
Rebounding index C
r
0.130 0.113
0.092
0.054
0.021
Creep coefficient C
α1
(σ
z
=100kPa)
0.0304 0.0263 0.0227 0.0062
0.0025
Creep coefficient C
α2
(σ
v
=400kPa)
0.0191 0.0141 0.0120 0.0051
0.0023
C
α
/C
c
(σ
z
=100kPa)
0.0965 0.0889 0.0873 0.0255
0.0240
C
α
/C
c
(σ
z
=400kPa)
0.0606 0.0476 0.0462 0.0210
0.0221
Swelling coefficient
C
s1
(σ
z
=10kPa)
0.0284 0.0251 0.0160 0.0085
0.0033
Swelling coefficient
C
s2
(σ
z
=50kPa)
0.0173 0.0131 0.0124 0.0062
0.0024
C
s1
/ C
r
(σ
z
=100kPa)
0.2185 0.2221 0.1739 0.1574
0.1571
C
s2
/ C
r
(σ
z
=400kPa)
0.1331 0.1159 0.1048 0.1148
0.1143
C
s1
/ C
c
(σ
z
=100kPa)
0.0902 0.0848 0.0615 0.0350
0.0317
C
s2
/ C
c
(σ
z
=400kPa)
0.0549 0.0443 0.0477 0.0255
0.0230
3. A NEW 1D ELASTIC VISCO-PLASTIC MODEL FOR
SOILS EXHIBITING BOTH CREEP AND SWELLING
Yin and Tong (2012) has developed a new Elastic Visco-Plastic
model considering both creep and swelling of the clays in one-
dimensional straining, called 1D EVPS model. This new model
is based on the previous 1D EVP models proposed by the first
author and his co-workers (Yin 1990; Yin and Graham 1989,
1994). Important concepts of “elastic” time line, “reference”
time lines in both creep and swelling regions, and “equivalent”
time lines are shown in Fig.3 in the plot of the vertical effective
stress in ln-scale and vertical strain. The “elastic” line has a
slope
V
/
and the two “reference” time lines in both creep and
swelling regions have the same slope
V
/
where
o
e
V
1
in
which
o
is the initial void ratio. Other parameters are also
shown in the figure such
and
. Yin and
Tong (2012) used the natural logarithmic functions to fit the
“elastic” time line, “reference” time lines, and creep
compression using equivalent time concept. The 1D EVPS
model can be derived and expressed as:
e
) , (
'
rs
zo
rs
zo
) ,
rc
zo
cr
zo
(
'
s
c
rs
zo
z
s
rs
zo z
s
o
s
rc
zo
z
c
rc
zo z
c
o
c
z
z
z
V
tV
V
tV V
'
'
'
'
'
'
]
exp[
1
]
exp[
1
(2)
where the parameters
are for creep compression and
are for swelling of the clays. Eq.(2) is a general
constitutive model for the time-dependent stress-strain behaviour
of soils exhibiting both creep and swelling in 1D straining. This
model is valid for all loading conditions such as constant rate of
strain (CRSN) loading, relaxation, unloading, reloading etc.
) ,
(
c
o
c
t
) , (
s
o
s
t
Yin and Tong (2012) has used data of a multi-staged
oedometer test on a bentonite mixed with 70% silicon silica
sand mixture (SMB) to determine values of all parameters in
Eq.(2). The basic properties can be found in Table 1. The initial
void ratio
e
o
is 5.5 (after pre-consolidation but before oedometer
testing). All values of these parameters are presented in Table 3.
This 1D EVP model has been used to simulate the stress-
strain behavior of the sane clay under step-changed constant-
rate of strain (CSR) loading with comparison with measured
data as shown in Figure 3. It is seen from this figure that the 1D
EBVPS
model
can
simulate
the
strain
effects,
unloading/reloading loops, and the non-linear stress-strain
behavior.
Table 3. Values of parameters in 1D EVPS model
Parameters
Bentonite with 70% sand
Elastic parameter
V
/
0.0542
Plastic parameter
V
/
0.1367
Creep parameter
c
0.01956
Creep parameter
c
o
t
24 hours
Swelling parameter
s
0.01554
Swelling parameter
s
o
t
24 hours
Interception stress
rc
'
zo
50 kPa
Interception strain
0
rc
zo
Interception stress
rs
'
zo
16 kPa
Interception strain
0
rs
zo
This 1D EVP model has also been used to simulate the
stress-strain behavior of the sane clay under singled staged
constant-rate of strain (CSR) loading with CSR of
. It is seen from the
figure that the higher the strain rate, the larger the effective
stress. The pre-consolidation pressure increases with the strain
rate.
sec / 10 sec,
/ 10 sec,
/ 10 sec,
/ 10
7
6
5
4
z
In addition, the 1D EVP model has also been used to
simulate the stress decreasing with tine (stress relaxation) in the
creep region and the stress increasing with tine (also called
stress relaxation) in the swelling region when the vertical strain
is kept a constant (Yin and Tong 2012). When the initial stress-
strain state point is in the swelling region (far away from the
normal consolidation line, the clay has a swelling potential so
that the stress will increase with time when the specimen is
confined in vertical thickness (strain is constant).
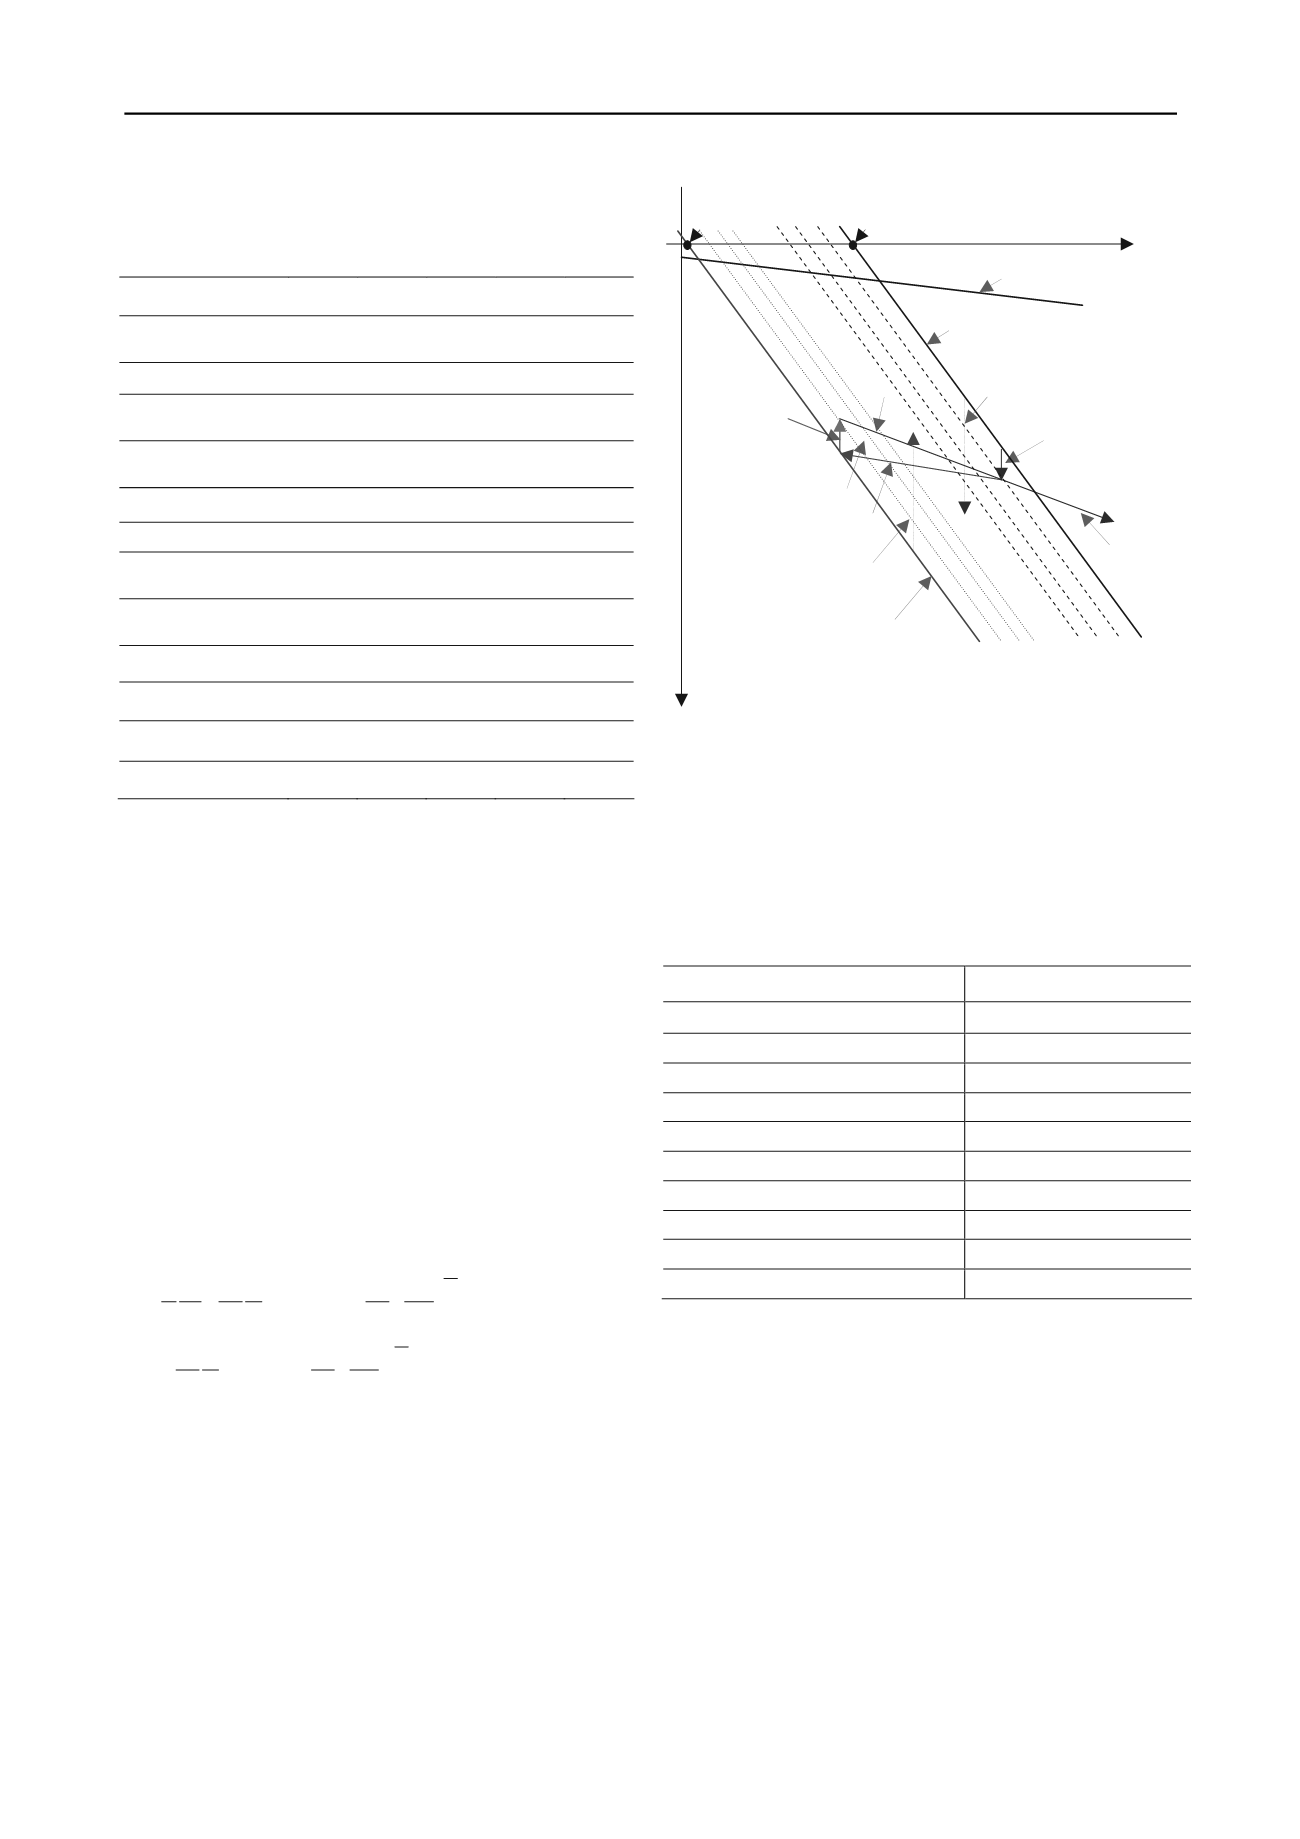
Figure 3. Conceptual illustration of creep, swelling, unloading-
reloading loop, “elastic” line, “reference” time line, and “equivalent”
time lines (extended from Yin 1990; Yin and Graham 1989, 1994,
1999)
Unloading
Swelling under
constant stress
Creep under
constant stress
Reloadin
g
Reloading
Unloading-reloading loop
Equivalent time lines for swelling
(swelling region)
Equivalent time lines for
creep (creep region)
'
ln
z
z
rc
zo
rc
zo
,
'
V
Slope
/ :
)
( / :
creep
for
line
tim
rs
zo
rs
zo
,
'
reference
V Slope
e
)
( / :
swelling
for
line
time
reference
V Slope


