236
Proceedings of the 18
th
International Conference on Soil Mechanics and Geotechnical Engineering, Paris 2013
供試体
φ 60× 20 mm
ポーラスストーン(φ
60× 5 mm)
ポーラスストーン(φ 56× 5 mm)
Loading piston
(one unit with
the specimen cap)
Vertical load
Ball bearing bushing
Specimen
(60 mm d x 20 m h)
Drainage line
Porous stone disc
(56 mm d x 5 mm h)
Drainage
Specimencap
(free vertical
movement,
guided against
rotation)
Porous stonedisc
(60 mm d x5 mm h)
Loading capsule
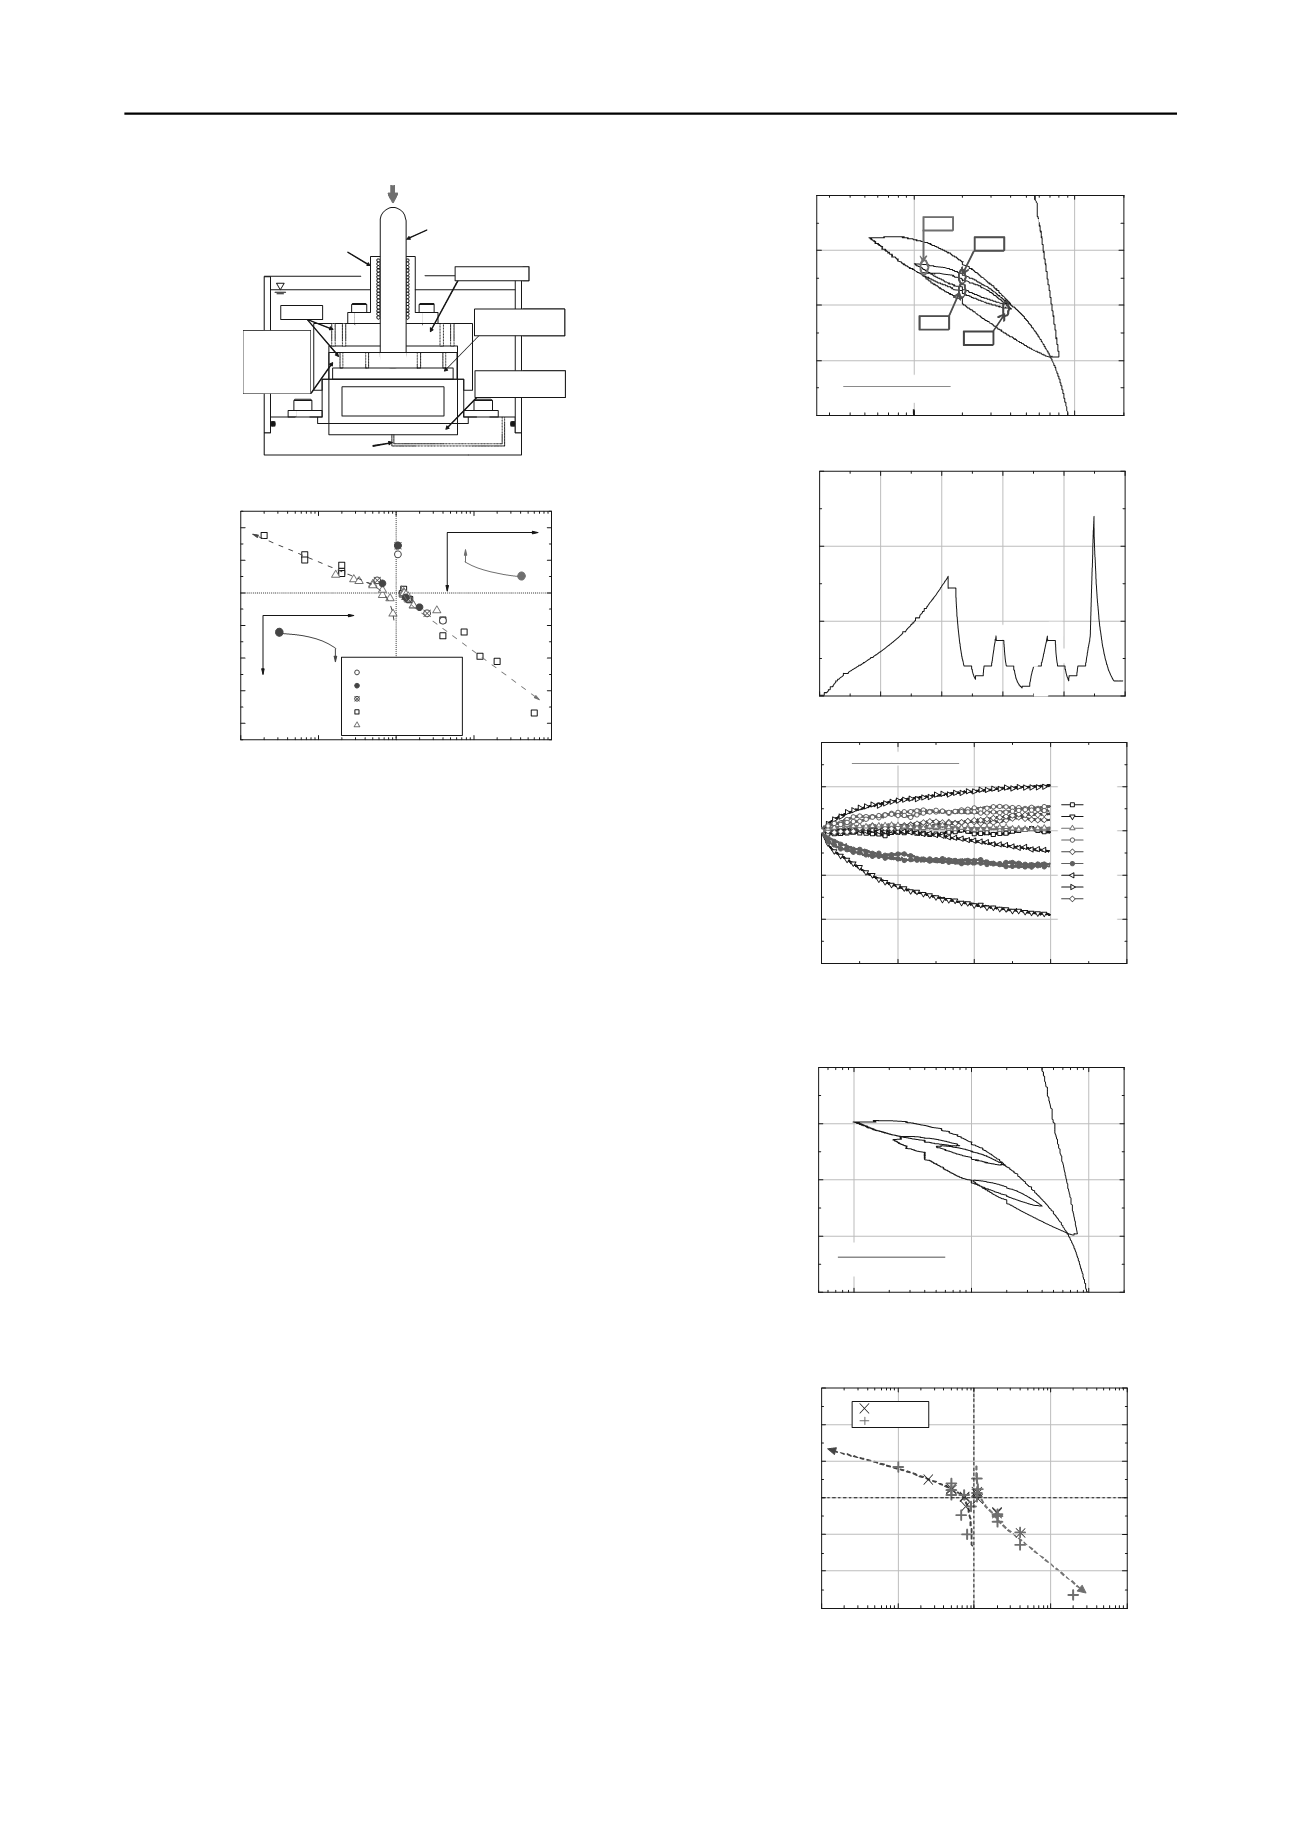
Figure 2. Oedometer used in the present study (Kongkitkul et al. 2011)
0.01
0.1
1
10
100
-0.4
-0.3
-0.2
-0.1
0.0
0.1
0.2
a(creep)
-
RL
/
SL
a(creep)
-
UL
/
SL
SL
UL
a(creep)
(%)
UL
/
SL
or
RL
/
SL
TEST 1 (Loop1)
TEST 1 (Loop2)
TEST 1 (Loop3)
TEST 2
TEST 3
log
a
a
SL
RL
log
a
a
Figure 3. Relationship between the creep strain and loading stress level
(Kawabe et al. 2011)
2 ONE-DIMENSIONAL COMPRESSION TESTS
The test method is basically the same as Kawabe et al. (2011).
Large clay cakes of two types of reconstituted soft clay,
Fujinomori clay (
L
≈ 42 % and PI ≈ 15) and kaolin clay
(
L
≈ 44 % and PI ≈ 16), were produced by consolidating
slurry prepared at a water content twice of the liquid limit at
=
100 kPa in a 20 cm diameter cylinder for a week. After having
applied a pre-load scheme to minimize effects of disturbance
during specimen preparation, each specimen, drained at the top
and bottom, was subjected to: monotonic recompression at
a
w
w
= 0.05 %/min to
a
= 100 kPa; SL for one day; UL at
a
= -
0.05 %/min to
a
= 100 kPa; and SL for one day. Logarithmic
axial strains are used throughout this paper. It was ensured that
the specimen under the conditions described above is always
essentially drained from the fact that the excess pore water
pressure measured at the undrained bottom of the specimen with
the drained top set in another apparatus was always less than
1 % of transient applied total axial stress (Kawabe et al. 2011).
So, the measured total axial stress,
a
, is regarded as the
effective axial stress.
3 TEST RESULTS
3.1 Creep during multiple unloading/reloading cycles
In the test described in Figure 4a (test FJM1008), a number of
SL stages for three hours were applied during multiple CSR
UL/RL cycles changing the stress amplitude. Figures 4b and c
show the time histories of
a
and creep axial strain at each SL
stage,
a(creep)
Δ
/
. In Figure 4c, the data sets for the same value
of
SL UL
or
SL
RL
/
are denoted by the same symbol.
The creep characteristics at similar value of
SL UL
/
or
SL
RL
/
are similar, independent of loading history and axial
stress at SL stage. The similar test result is shown in Figure 5. It
is to be noted that these relations change with changes in the
elapsed time of SL.
a)
100
1000
19
18
17
16
15
Test Name: FJM1008
w
0
= 37.5 %, e
0
= 1.02
Axial strain,
a
(%)
Axial stress,
a
(kPa)
500
④
,
⑫
③
,
⑪
⑤
,
⑨
⑥
,
⑩
b)
0
24
48
72
96
1
0
500
1000
1500
20
⑫
⑪
⑩
⑨
⑧
⑦
⑥
⑤
④
③
②
Axial stress,
a
(kPa)
Elapsed time,
t (hour)
①
c)
0
1
2
3
-0.15
-0.10
-0.05
0.00
0.05
0.10
4
Test Name: FJM1008
Creep axial strain,
a(creep)
(%)
Elapsed time,
t (hour)
①
②
③ , ⑪
④ , ⑫
⑤ , ⑨
⑥ , ⑩
⑦
⑧
⑨
Figure 4. a) Zoom-upped
a
a
log
relations; b) stress history; and
c) time history of creep strain, test FJM1008
10
100
1000
18
16
14
12
10
Test Name: FJM1016
w
0
= 41.8 %, e
0
= 1.11
Axial strain,
a
(%)
Axial stress,
a
(kPa)
Figure 5. Zoom-upped
a
a
log
relation. test FJM1016
0.01
0.1
1
10
100
-0.3
-0.2
-0.1
0.0
0.1
0.2
0.3
Creep axial strain,
a(creep)
(%)
UL
/
SL
or
RL
/
SL
FJM1008
FJM1016
Figure 6.
a(creep)
Δ
-
SL UL
/
or
SL
RL
/
relations, tests
FJM1008 and FJM 1016
Figure 6 shows the relationship between
a(creep)
Δ
for three
hours and the stress ratio,
SL UL
/
or
SL
RL
/
, at each SL


