240
Proceedings of the 18
th
International Conference on Soil Mechanics and Geotechnical Engineering, Paris 2013
Proceedings of the 18
th
International Conference on Soil Mechanics and Geotechnical Engineering, Paris 2013
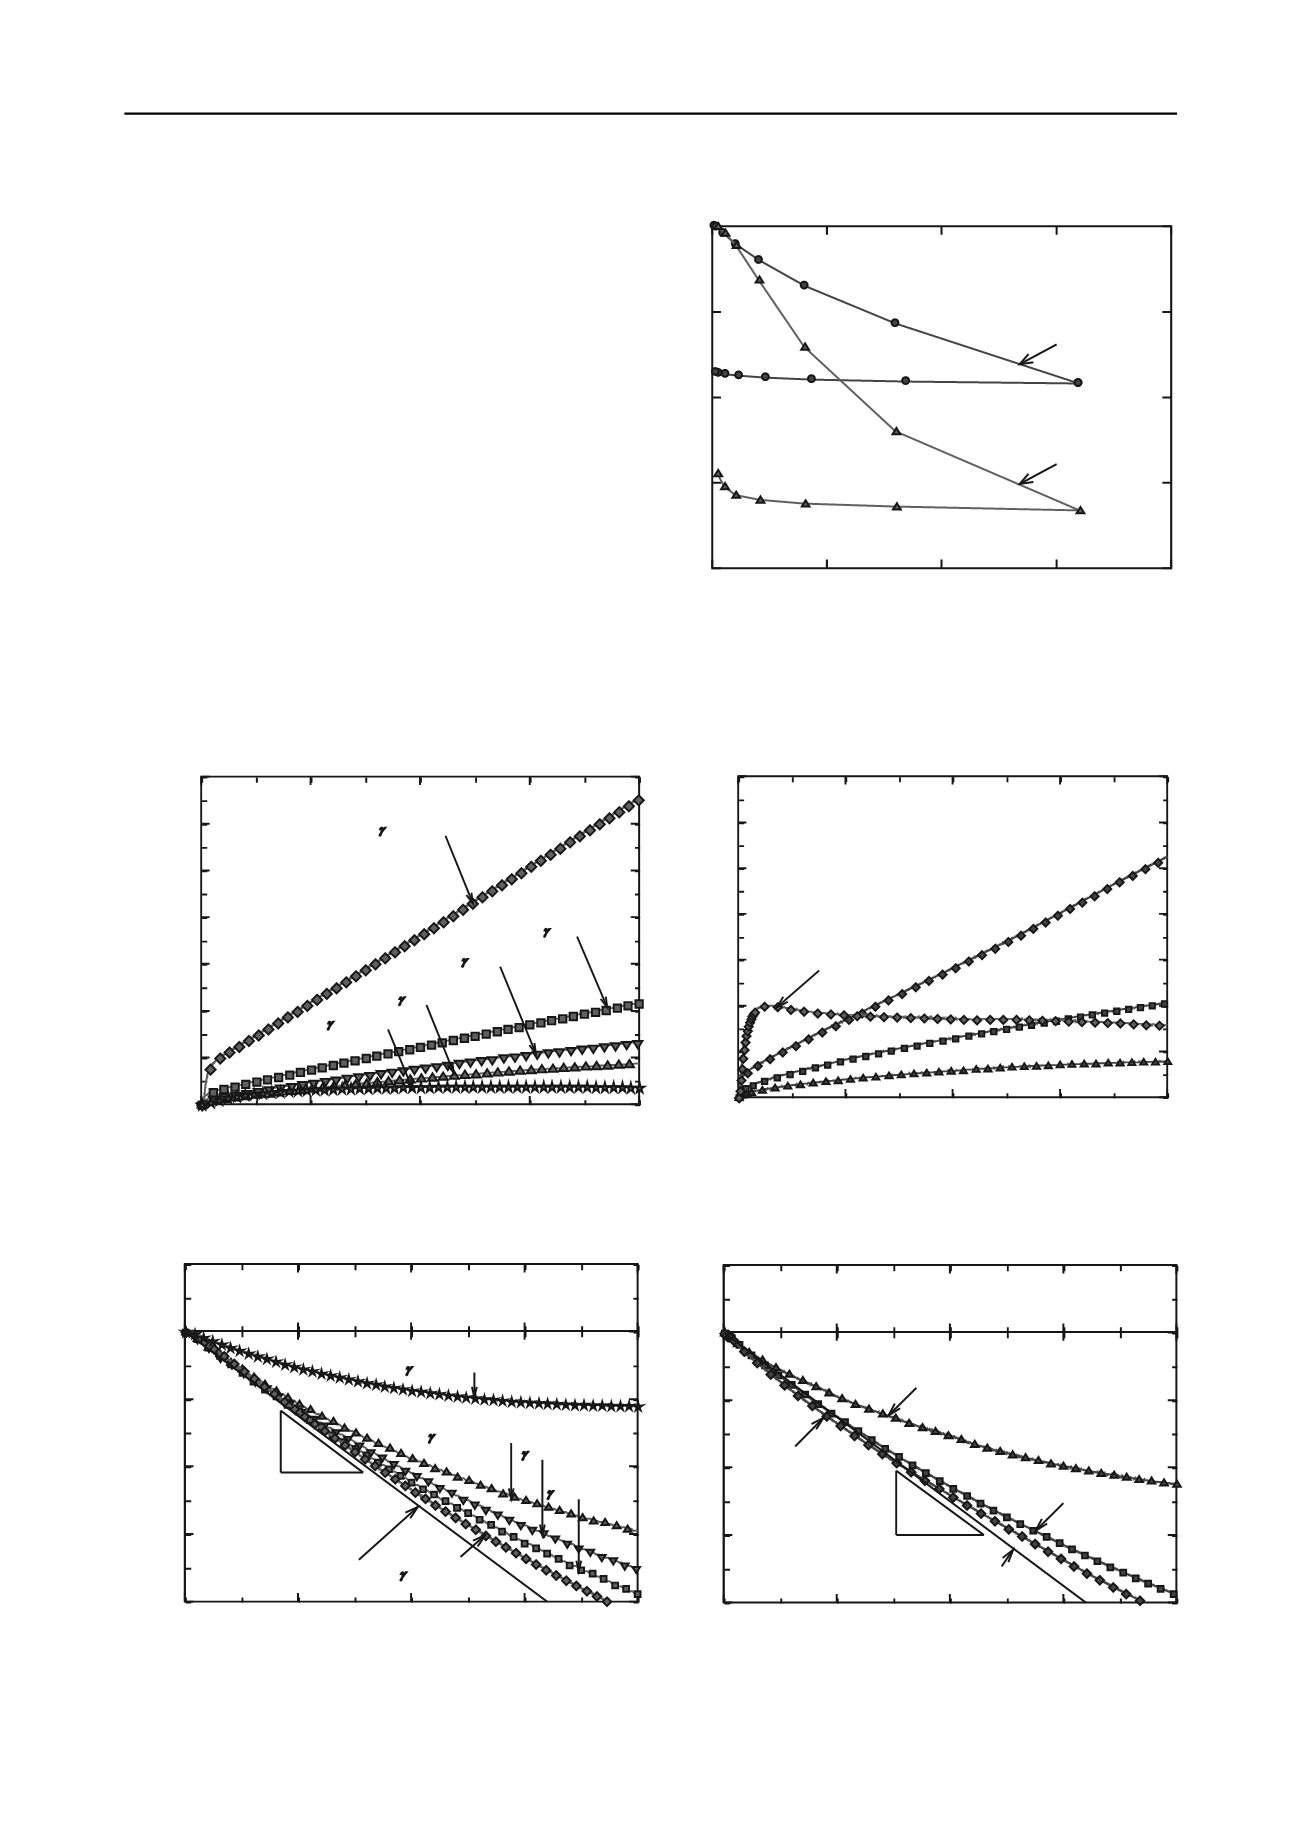
crease in volume means that the tests were done on loose
material. Also marked on these plots is a line indicating one
dimensional compression, that is the volumetric strain is equal
to the axial strain, hence along this line the shearing occurs
without change in diameter of the specimen.
Figure 4 plots contours of equal axial strain on a set of axes
with deviator stress on the vertical axis and mean principal
effective stress on the horizontal axis. (The deviator stress is: q
=
1
-
3
, and the mean principal stress is: p
= (
1
+ 2
3
)
/3). The first, and most important observation from these plots,
is that the mobilization of the drained shear resistance for both
pumice sands continues to increase with increasing axial strain,
also apparent from Figure 2. Note that this is not so for the
undrained test also shown in Figure 2b. Any point on the plots
in Figure 4 indicates a mobilized friction angle, as the ratio of
q/p
can be used to calculate the mobilized friction angle at that
point. Looking at the data in Figure 4a, one can draw a
tangential envelope near the origin which defines a friction
angle of about 41 degrees. Next taking the highest point on the
20% strain contour the q/p
ratio defines a friction angle of
about 30 degrees. Thus although the shear resistance continues
to increase with increasing axial strain the mobilized friction
angle decreases. Similar comments can be made about the data
for the New Zealand pumice shown in Figure 4b.
0
5
10
15
20
0
500
1000
1500
2000
2500
3000
3500
Deviator stress
q
(kN/m
2
)
Axial strain
a
(%)
NZ pumice
1600kPa
NZ pumice
400kPa
NZ pumice
100kPa
NZ pumice
1600kPa,CU test
0
5
10
15
20
0
500
1000
1500
2000
2500
3000
3500
Deviator stress
q
(kN/m
2
)
Axial strain
a
(%)
100kPa
d
=5.70kN/m
3
50kPa
d
=5.74kN/m
3
1600kPa
d
=5.77kN/m
3
200kPa
d
=5.72kN/m
3
400kPa
d
=5.70kN/m
3
0
5
10
15
20
16
12
8
4
0
-4
Volumetric strain
v
(%)
Axial s train
a
(%)
NZ pumice
100kPa
NZ pumice
1600kPa
NZ pumice
400kPa
1
1
One dimensional
compression
0
5
10
15
20
16
12
8
4
0
-4
Volumetric strain
v
(%)
Axial s train
a
(%)
1
1
One dimensional
compression
100kPa
d
=5.70kN/m
3
50kPa
d
=5.74kN/m
3
1600kPa
d
=5.77kN/m
3
200kPa
d
=5.72kN/m
3
400kPa
d
=5.70kN/m
3
(a) JPN pumice
(b) NZ pumice
Figure 2. Triaxial test deviator stress versus axial strain.
Figure 1. Volumetric strain under hydrostatic compression.
(a) JPN pumice
(b) NZ pumice
Figure 3. Drained triaxial test volumetric strain versus axial strain.
0
500
1000
1500
2000
40
30
20
10
0
Volumetric strain
v
(%)
Mean effec tive princ ipal stress
p
' (kPa)
NZ pumice
JPN pumice


