241
Technical Committee 101 - Session I /
Comité technique 101 - Session I
Proceedings of the 18
th
International Conference on Soil Mechanics and Geotechnical Engineering, Paris 2013
0.001
0.01
0.1
1
0
20
40
60
80
100
Passing finer by weight (%)
Particle size (mm)
:Toyoura sand
:JPN pumice, before test
(sieved in dry)
before test
(sieved in dry)
:JPN pumice,before test
(wet sieved)
before test
(wet sieved)
:JPN pumice,after consolidation
(wet sieved)
:JPN pumice,after CD at 50kPa
(wet sieved)
:JPN pumice,after CD at 100kPa
(wet sieved)
:JPN pumice,after CD at 200kPa
(wet sieved)
:JPN pumice,after CD at 400kPa
(wet sieved)
:JPN pumice,after CD at 1600kPa
(wet sieved)
0 500 1000 1500 2000 2500 3000 3500
0
500
1000
1500
2000
2500
3000
3500
Deviator stress
q
(kN/m
2
)
Mean princ ipal stress
p
' (kN/m
2
)
a
=5%
a
=10%
a
=15%
a
=20%
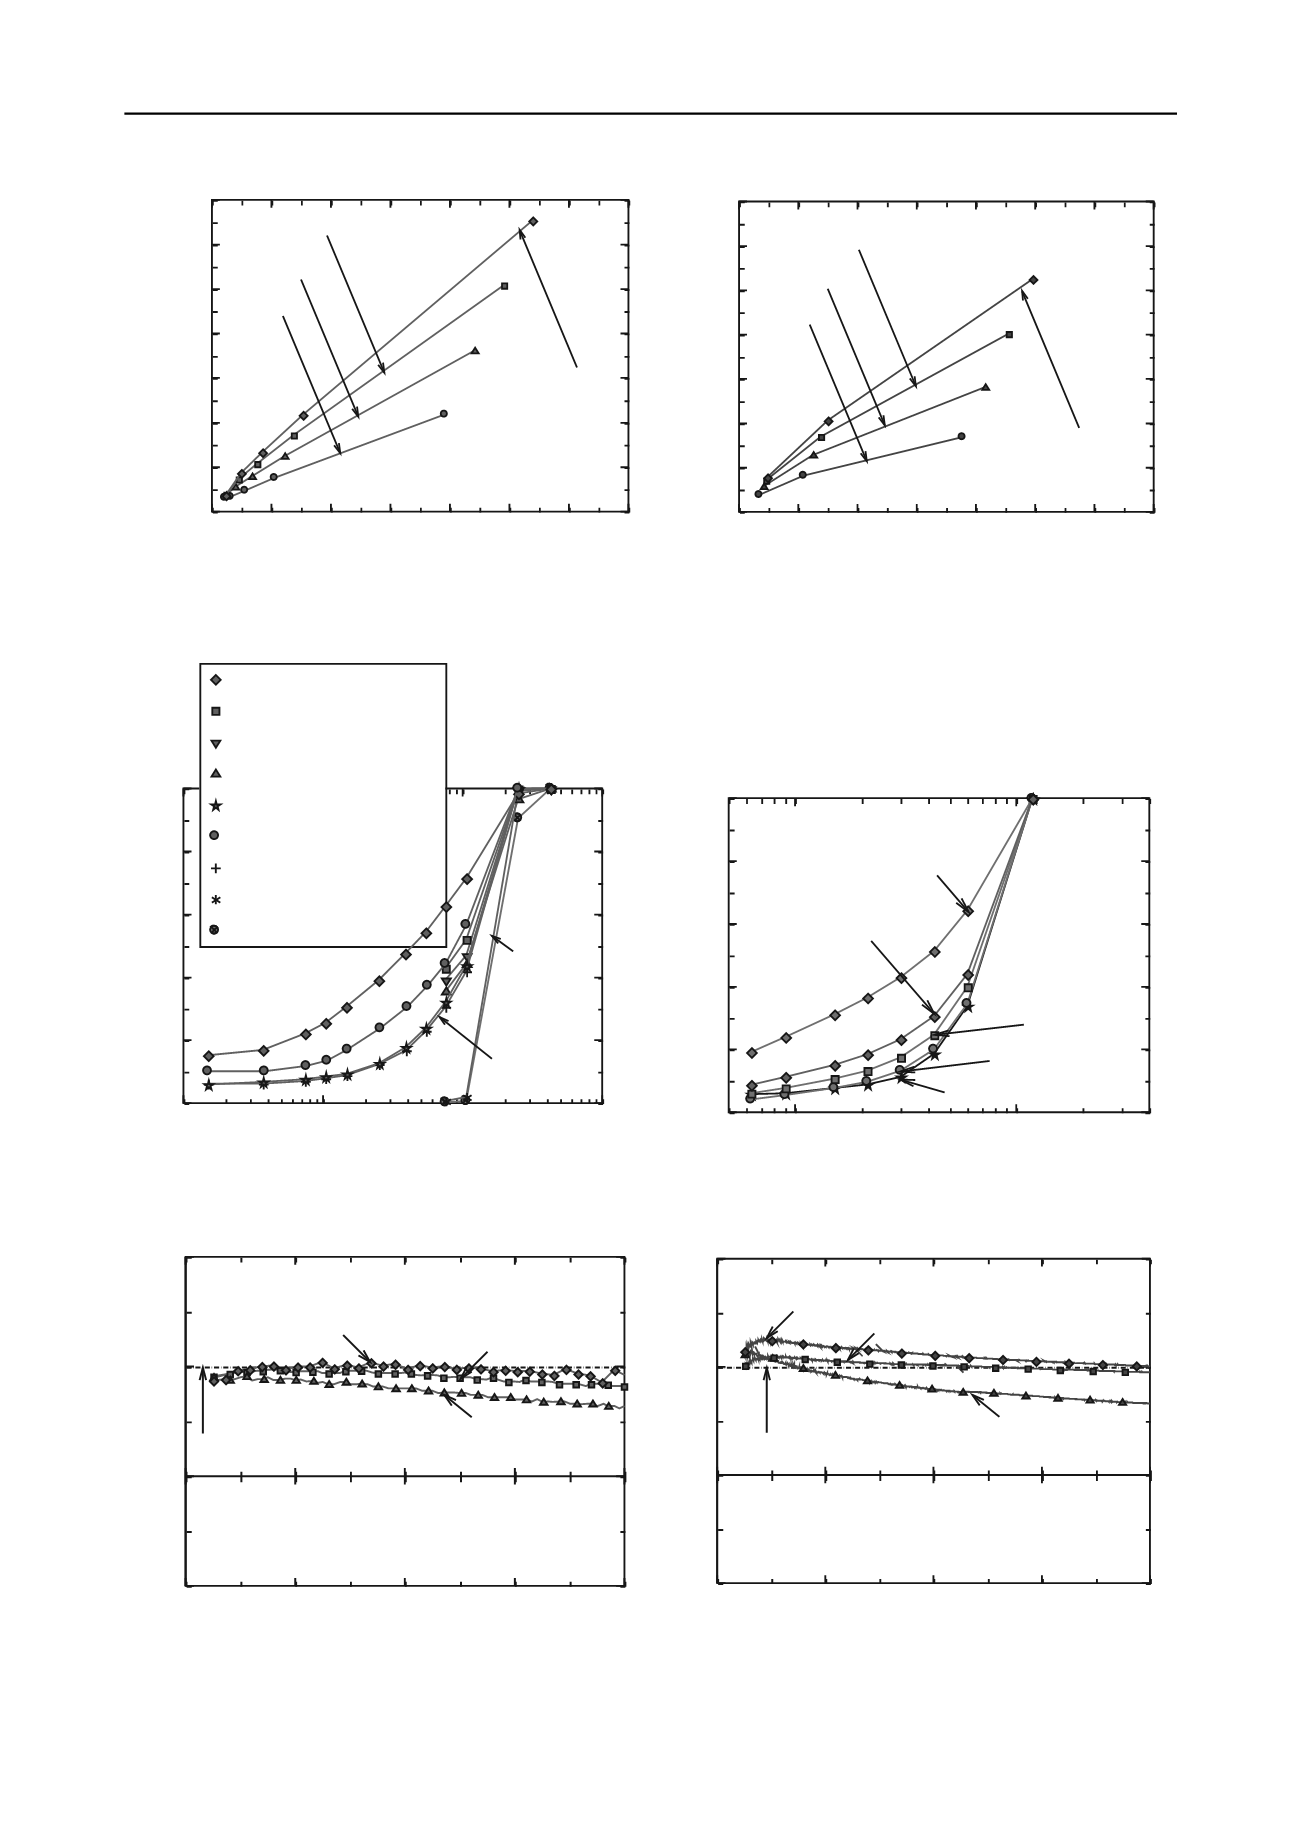
(a) JPN pumice
(b) NZ pumice
Figure 4. Deviator stress against mean principal effective stress for drained triaxial tests.
0 500 1000 1500 2000 2500 3000 3500
0
500
1000
1500
2000
2500
3000
3500
Deviator stress
q
(kN/m
2
)
Mean principal stress
p
' (kN/m
2
)
a
=5%
a
=10%
a
=15%
a
=20%
(a) JPN pumice
(b) NZ pumice
Figure 5. Particle Size Distribution before and after testing.
0
2
4
6
8
-1
0
1
2
Strain ratio
d
v
/
d
a
Axial s train
a
(%)
JPN pumice
d
=5.70kN/m
2
100kPa
JPN pumice
d
=5.77kN/m
2
1600kPa
JPN pumice
d
=5.70kN/m
2
400kPa
One dimensional
compression
0
2
4
6
8
-1
0
1
2
Strain ratio
d
v
/
d
a
Axial strain
a
(%)
NZ pumice
100kPa
NZ pumice
1600kPa NZ pumice
400kPa
One dimensional
compression
0.1
1
0
20
40
60
80
100
Passing finer by weight
Particle s ize (mm)
4
0.05
before test
after hydrostatic
compression
400kPa
1600kPa
CU test, 1600kPa
NZ pumice
(a) JPN pumice
(b) NZ pumice
Figure 6. Strain ratio against axial strain for the drained triaxial tests.


