225
Technical Committee 101 - Session I /
Comité technique 101 - Session I
Proceedings of the 18
th
International Conference on Soil Mechanics and Geotechnical Engineering, Paris 2013
sample from Nantou in central Taiwan. The liquid limit and
plastic limit of the soil sample are 106% and 44%, respectively.
The soil sample is reconstituted in the laboratory with a water
content of 155% which is about 1.5 times of the liquid limit. A
200-mm diameter consolidometer is used to prepare identical
soil specimens for the surcharging tests. Five oedometer rings
are placed with proper spacing in between in the consolidometer
and then the consolidometer is filled up with the 155% water
content soil sample. The soil in the consolidometer is
incrementally loaded to 50 kPa and then unloaded. By this way,
five identical oedometer specimens are obtained with a
preconsolidation pressure of 50 kPa. These specimens have
initial water contents around 88%±1%. Four specimens are
used to conduct oedometer tests with different consolidation
stress histories illustrated in Figs. 2~5. Specimen #5 is tested
according to the stress history described in Fig. 2(a) but is
unloaded prior to the end of primary consolidation.
Secondary compression characteristics of natural soils can be
expressed in terms of the compressibility ratio
c
CC
(Terzaghi
et al. 1996), where
is the secondary compression index and
is the compression index. The compressibility ratio and
compression index of the organic clay tested are 0.063 and 0.7,
respectively. The secondary compression of the laboratory
specimens tested with or without surcharging is observed at two
different final effective stresses, i.e. 109.6 kPa and 438.4 kPa,
for a period that is about two times of the time of end of primary
consolidation. Effective surcharge ratios of 0.25 and of 0.125
are used for final effective stresses of 109.6 kPa and of 438.4
kPa, respectively. Significant surcharging test results are
presented and discussed herewith.
C
c
C
2.2
Test results and discussions
Effect of surcharging on secondary compression, if any, can be
directly observed from the consolidation curves with or without
surcharging as shown in Fig. 3 and Fig. 4. In these two figures,
curve A is the consolidation curve without surcharging, curve B
is the consolidation curve with surcharging by the type
described in Fig. 2(a), curve C is the consolidation curve with
surcharging by the type described in Fig. 2(b), curve D is the
consolidation curve with preloading by the type described in Fig.
2(c), and curve E is the consolidation curve with surcharging by
the type described in Fig. 2(a) but the specimen is unloaded
prior to the end of primary consolidation.
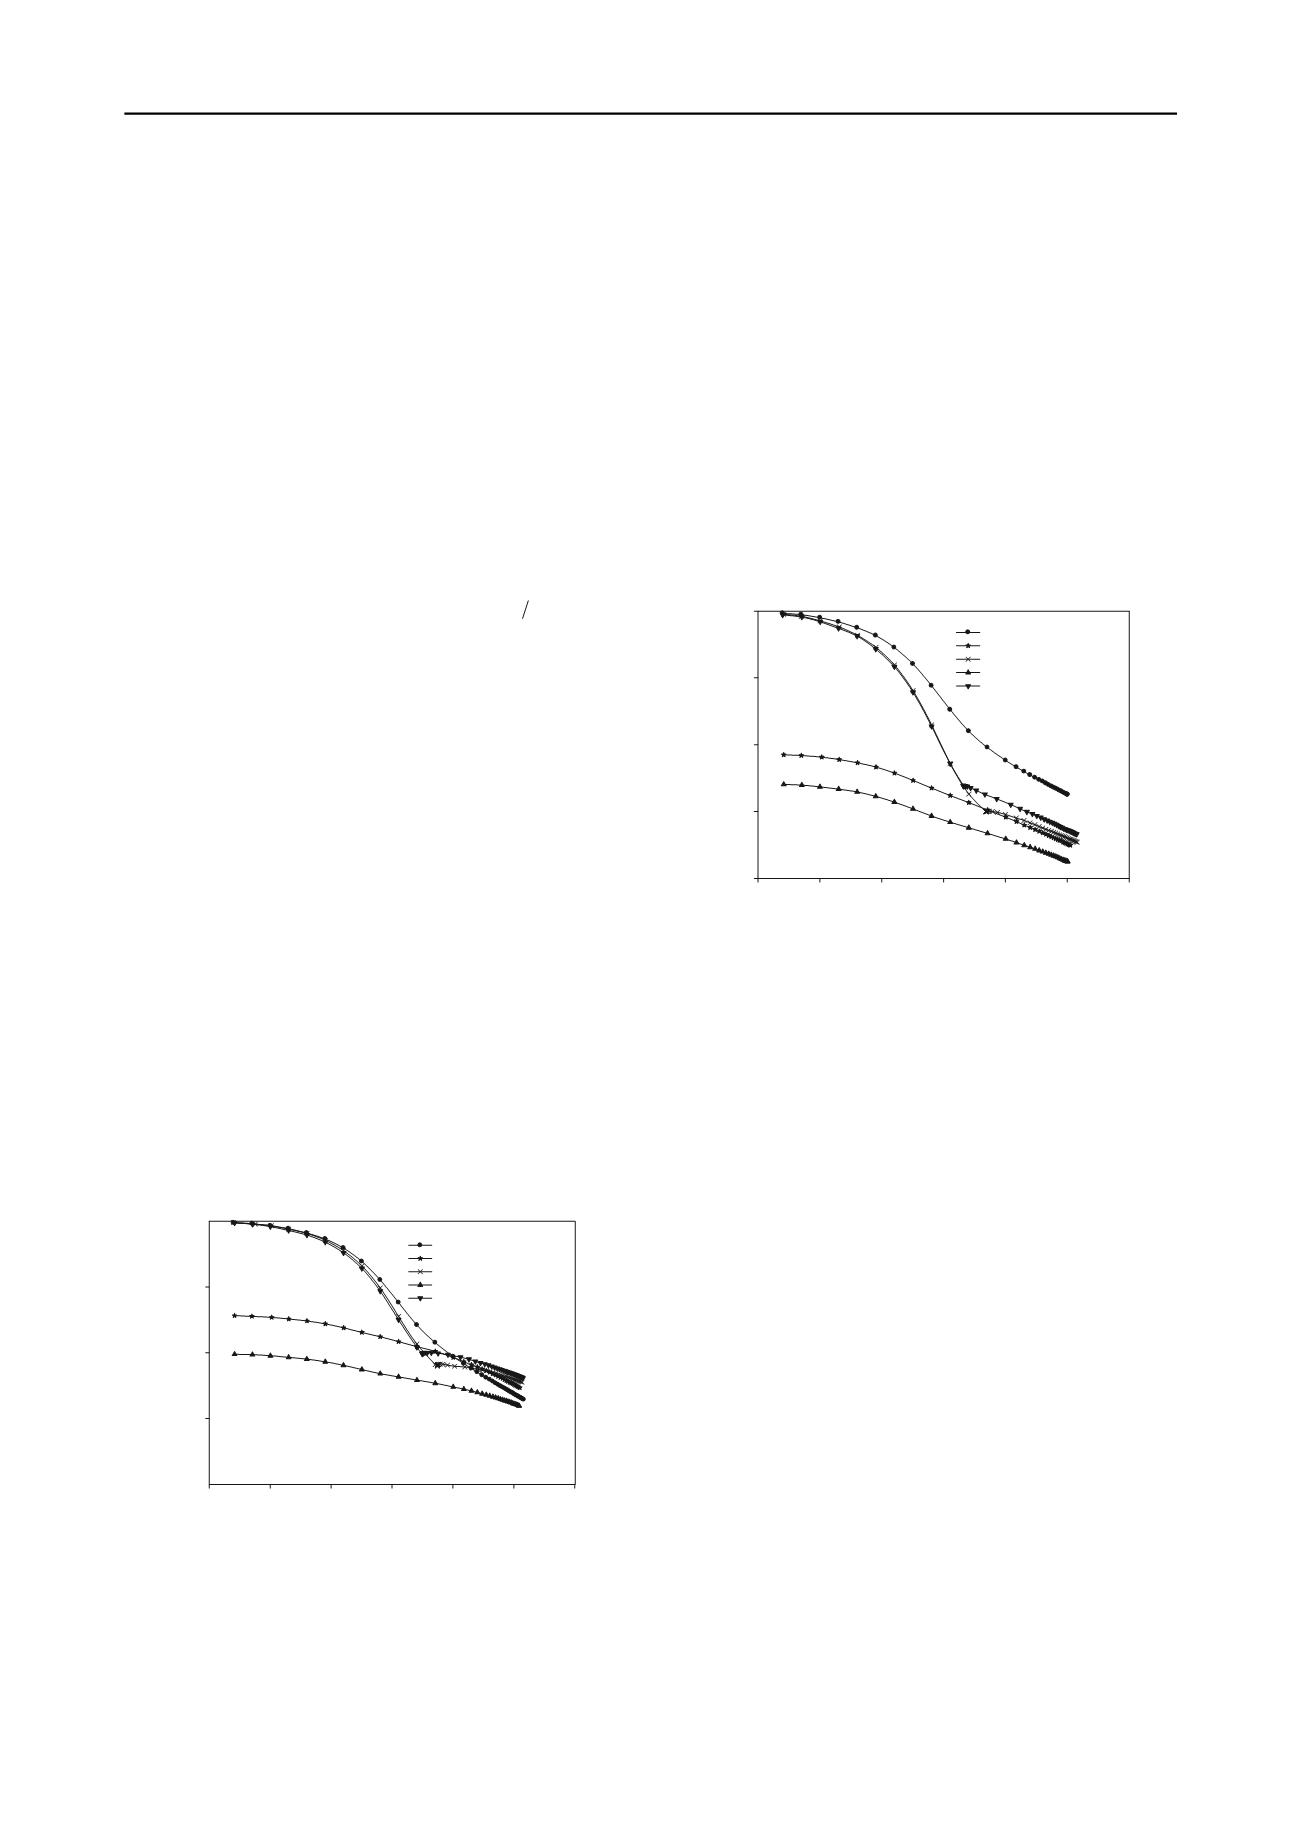
Final effective stress 109.6 kPa
Time (min)
0.01
0.1
1
10
100
1000
10000
Compression (mm)
0.0
0.5
1.0
1.5
2.0
Without surcharging
Preload with reloading
Surcharging without reloading
Surcharging with reloading
Surcharging with early removal
E
A
C
D
B
Figure 3. Consolidation curves of different surcharging stress histories
with effective surcharge ratio equal to 0.25
It can be seen from Fig. 3 that the slopes of the secondary
compression portion of curves B~D are smaller than that of
curve A. These data indicate that surcharging or preloading of
the types used has reduced the magnitude of secondary
compression to somewhat different degrees. Curve E shows
about the same magnitude of secondary compression as that of
curve A, which can be expected since the specimen is unloaded
too early to receive a beneficial effect from surcharging.
Similar test results are shown in Fig. 4 for higher final effective
stress and smaller effective surcharge ratio than those shown in
Fig. 3. However, it appears from Fig. 4 that the slopes of the
later secondary compression portion of all five curves are very
close to each other. This is probably partly because the
effective surcharge ratio of 0.125 used is rather small so that the
reduction in secondary compression is highly limited. These
findings suggest that the magnitude of post-surcharge secondary
compression is a function of the consolidation stress history
imposed on the soft soil. For small effective surcharge ratios
achieved in engineering practice, the magnitude of secondary
compression may not be reduced to an acceptable level so that
long term secondary compression settlement may still be
excessive.
Final effective stress 438.4 kPa
Time (min)
0.01
0.1
1
10
100
1000
10000
Compression (mm)
0.0
0.5
1.0
1.5
2.0
Without surcharging
Prealod with reloading
Surcharging without reloading
Surcharging with reloading
Surcharging with early removal
E
D
C
B
A
Figure 4. Consolidation curves of different surcharging stress histories
with effective surcharge ratio equal to 0.125
The post-surcharge secondary compression characteristics of the
Taipei clay are quite different from those of the Nantou clay.
Figure 5 shows consolidation curves of these two clays with or
without surcharging, all in the normally consolidated range.
The load increment ratio used for the increments without
surcharging is 1. The loading increment ratio used for the
increments with surcharging is higher than 1 since the surcharge
load is added with the final load at the same time. The
surcharge load is removed at a time near the end of primary
consolidation. During the primary consolidation stage, the
Nantou clay specimen consolidates much slower and
compresses more than those of the Taipei clay specimen. The
compressibility ratio and compression index of the Taipei clay
are 0.039 and 0.3, respectively, which are much smaller than
those of the Nantou clay. It can be seen from Fig. 5 that, after
surcharge removal, the Taipei clay specimen rebounds slightly
and continuously for a relatively long period of time before
secondary compression appears. As a comparison, the Nantou
clay specimen rebounds very slightly and shortly before
secondary compression appears. The effective surcharge ratios
used in these tests are about the same and do reduce the
secondary compression to a certain degree. But it appears that
characteristics of post-surcharge secondary compression vary
from one soil to another soil.


