217
Technical Committee 101 - Session I /
Comité technique 101 - Session I
Proceedings of the 18
th
International Conference on Soil Mechanics and Geotechnical Engineering, Paris 2013
Mesri and Feng (2009) present two figures of excess pore
pressure versus time for Batiscan clay to show that sufficient
time is given for the 508 mm thick specimen to reach EOP. The
stress increments they presented were for a step well before the
initial
p
′
c
and for a step after exceeding the initial
p
′
c
. However,
they did not present the most important step, i.e. the step that
starts below and exceeds the initial
p
′
c
. Here lies the main
misconception, as Mesri and Feng (2009) tend to continue to
underrate the importance of the load increment that exceeds the
initial
p
′
c
.
Applying the interpretation shown in Figure 2, the resulting
stress-strain relationship of the St. Hilaire clay is shown in
Figure 3. The interpreted experimental data clearly imply
hypothesis B, unlike the original curves where inconsistent EOP
criteria were used to wrongly advocate hypothesis A. Mesri and
Feng (2009) wondered about the re-interpretation of the load
increment after exceeding
p
′
c
(the broken lines in Fig 3).
However, referring to the broken line in Figure 3, Degago et al.
(2009) clearly stated
“a
similar re-interpretation procedure
could not be adopted for the following steps since the thin
specimen has
already exceeded its EOP condition”.
To establish
the broken lines Degago et al. (2009) simply used the fact that,
after exceeding
p
′
c
, the incremental strain for a thin and thick
specimen are almost the same, see Figure 1.
St. Hilaire clay
500 mm
0
2
4
6
St. Hilaire clay
500 mm
St. Hilaire clay
125 mm
0
3
St. Hilaire clay
125 mm
10
0
Excess pore pressure [kPa]
Volumetric strain [%]
10
2
10
4
10
6
10
0
10
3
10
5
Time [min]
Time [min]
508 mm
508 mm
127 m
1 7 m
30
20
0
2
4
6
8
40
10
10
Correct EOP strains
?
?
Figure 2. Re-evaluation of experimental results of St. Hilaire clay for
the load increment that exceeds
p
′
c
(raw data after Feng, 1991)
0
40
80
120
160
Effective stress [kPa]
20
16
12
8
4
0
Volumetric strain [%]
508 mm original
127 mm original
127 mm re-interpreted
Figure 3. EOP volumetric strain-effective stress relationship of thin and
thick specimen of St. Hilaire clay for the load increment that exceeds
p
′
c
(raw data after Feng, 1991)
Regarding soil element compressibility, Degago et al. (2010)
conducted a test to show that a soil element close to the
drainage boundary does not wait for the global EOP state before
starting secondary compression. This was also found when
Degago et al. (2011a) revisited the sub-specimen nominal strain
versus time relationships of the 508 mm samples of Batiscan
and St. Hilaire clay conducted by Feng (1991). For the step
exceeding the initial
p
′
c
, the tests showed largest deformation on
the sub-specimen closest towards the drainage boundary. This is
in accord with predictions by the isotache concept and contrary
to the claims made by Mesri and Vardhanabhuti (2006).
4.2
Field studies
Mesri and Feng (2009) argued that
“the computer program
based on Soft Soil Creep (SSC) model should be applied to field
situation with primary consolidation duration of 30 to 50 years
before reaching any general conclusion on EOP compression
and on the uniqueness of pre
consolidation pressure”.
In addition
they presented excellent settlement predictions of field cases to
illustrate the validity of hypothesis A. In connection to this,
Degago et al. (2011b) studied 57 years of settlement data from
the Väsby test fill and have clarified two misconceptions
observed in the arguments by Mesri and Feng (2009) regarding
their field predictions. First, it was clearly illustrated that the
excellent settlement predictions and somehow lower excess
pore pressure predictions by ILLICON were due to use of soil
data from highly disturbed samples along with inappropriate
analysis assumption. Secondly, it was demonstrated that when
one interprets soil data from high quality samples then the
isotache model (SSC) gives excellent settlement as well as
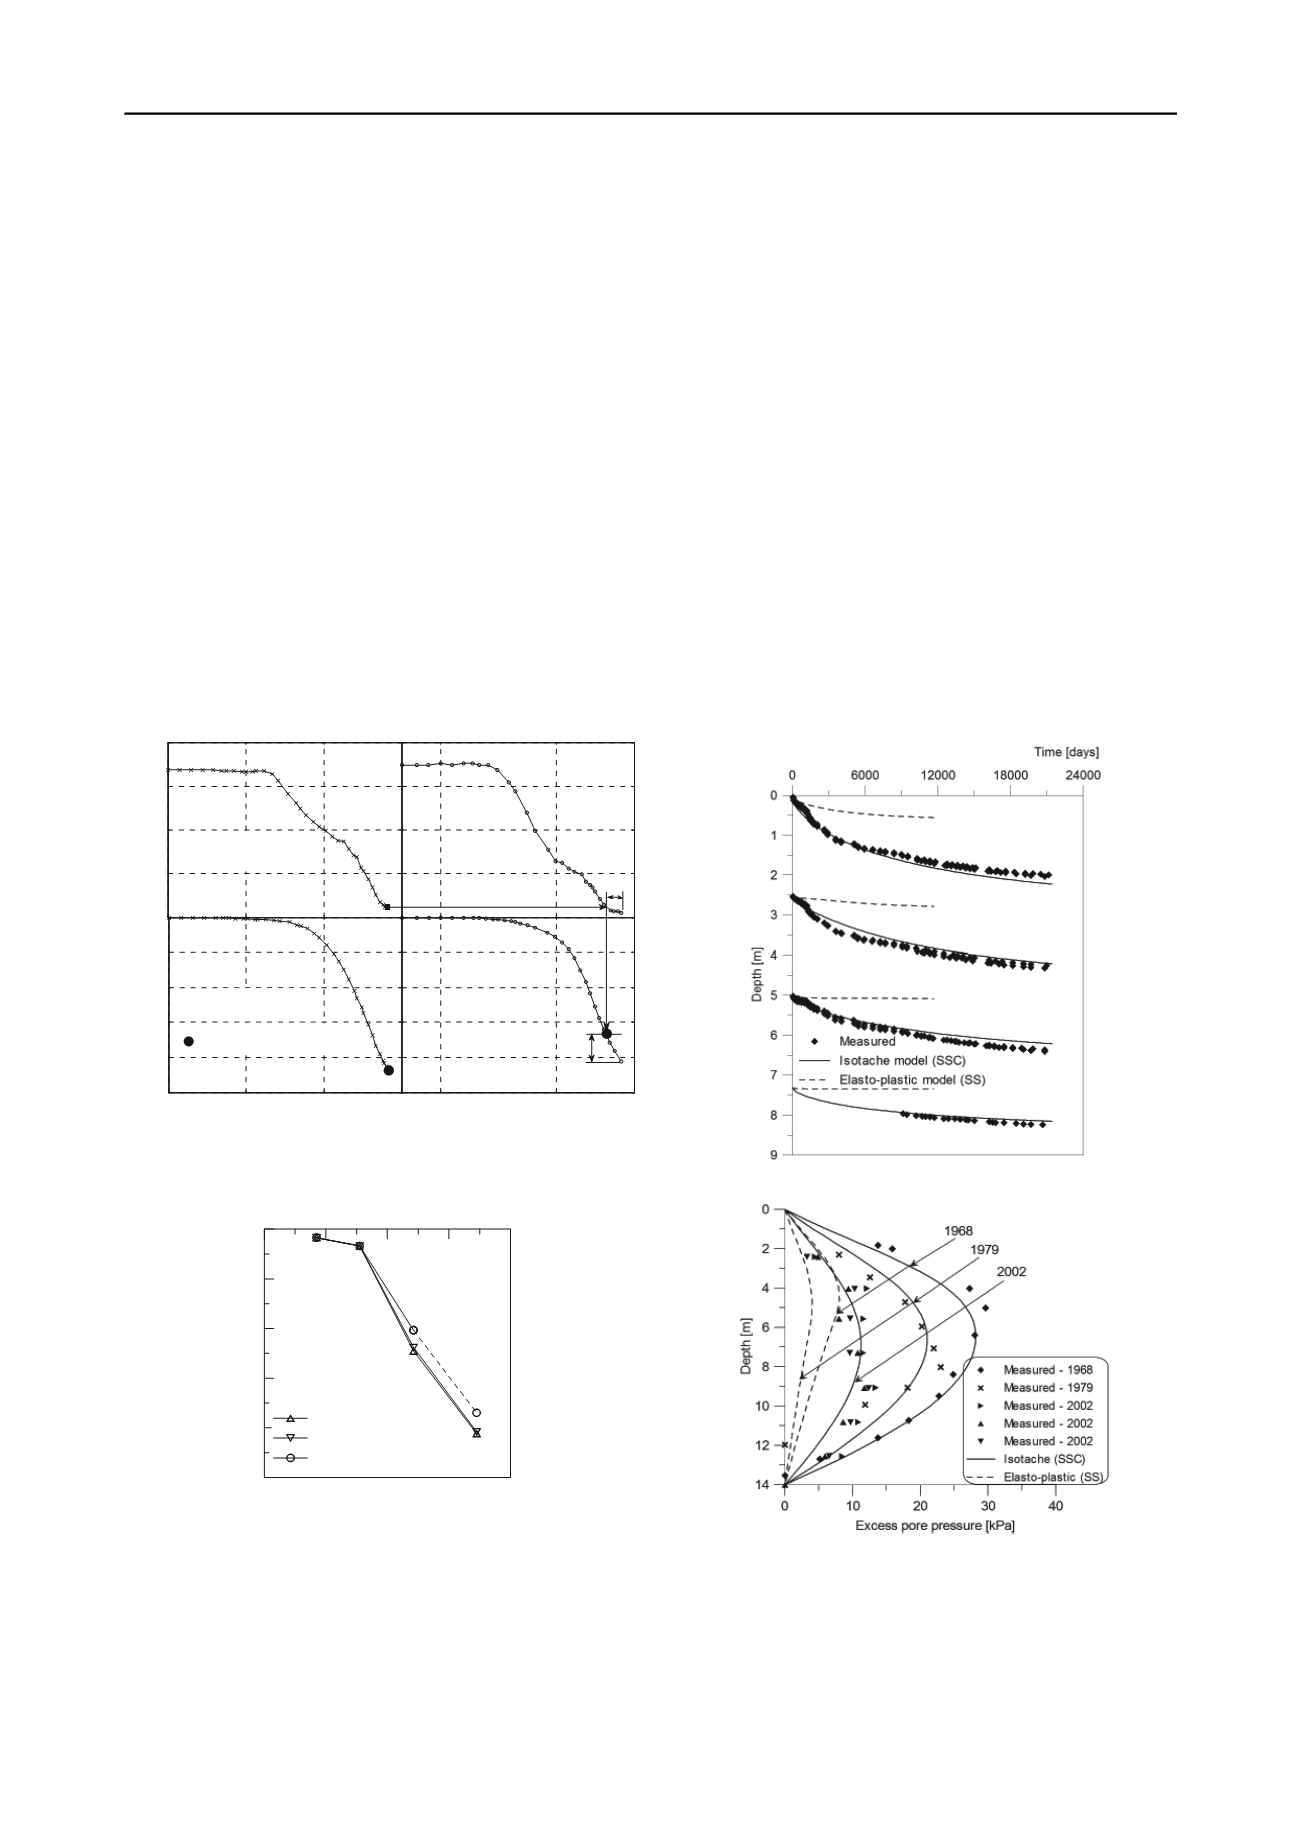
excess pore pressure predictions, see Figure 4 and Figure 5.
Figure 4. Time-displacement curves for different depths (Degago et al.
2011b)
Figure 5. Excess pore pressure profiles for different times plotted
against undeformed soil layer depth (Degago et al. 2011b)
A typical oedometer test used in the analysis of Väsby test
fill by ILLICON (Mesri and Choi, 1995a) had an EOP
overconsolidation ratio (OCR) value of 1.3 as compared to the
more correct value of 1.8 interpreted from high quality block
samples (Leroueil and Kabbaj 1987). The implication of this is
that, had Mesri and Choi (1985a) used high quality data,


