209
Technical Committee 101 - Session I /
Comité technique 101 - Session I
Proceedings of the 18
th
International Conference on Soil Mechanics and Geotechnical Engineering, Paris 2013
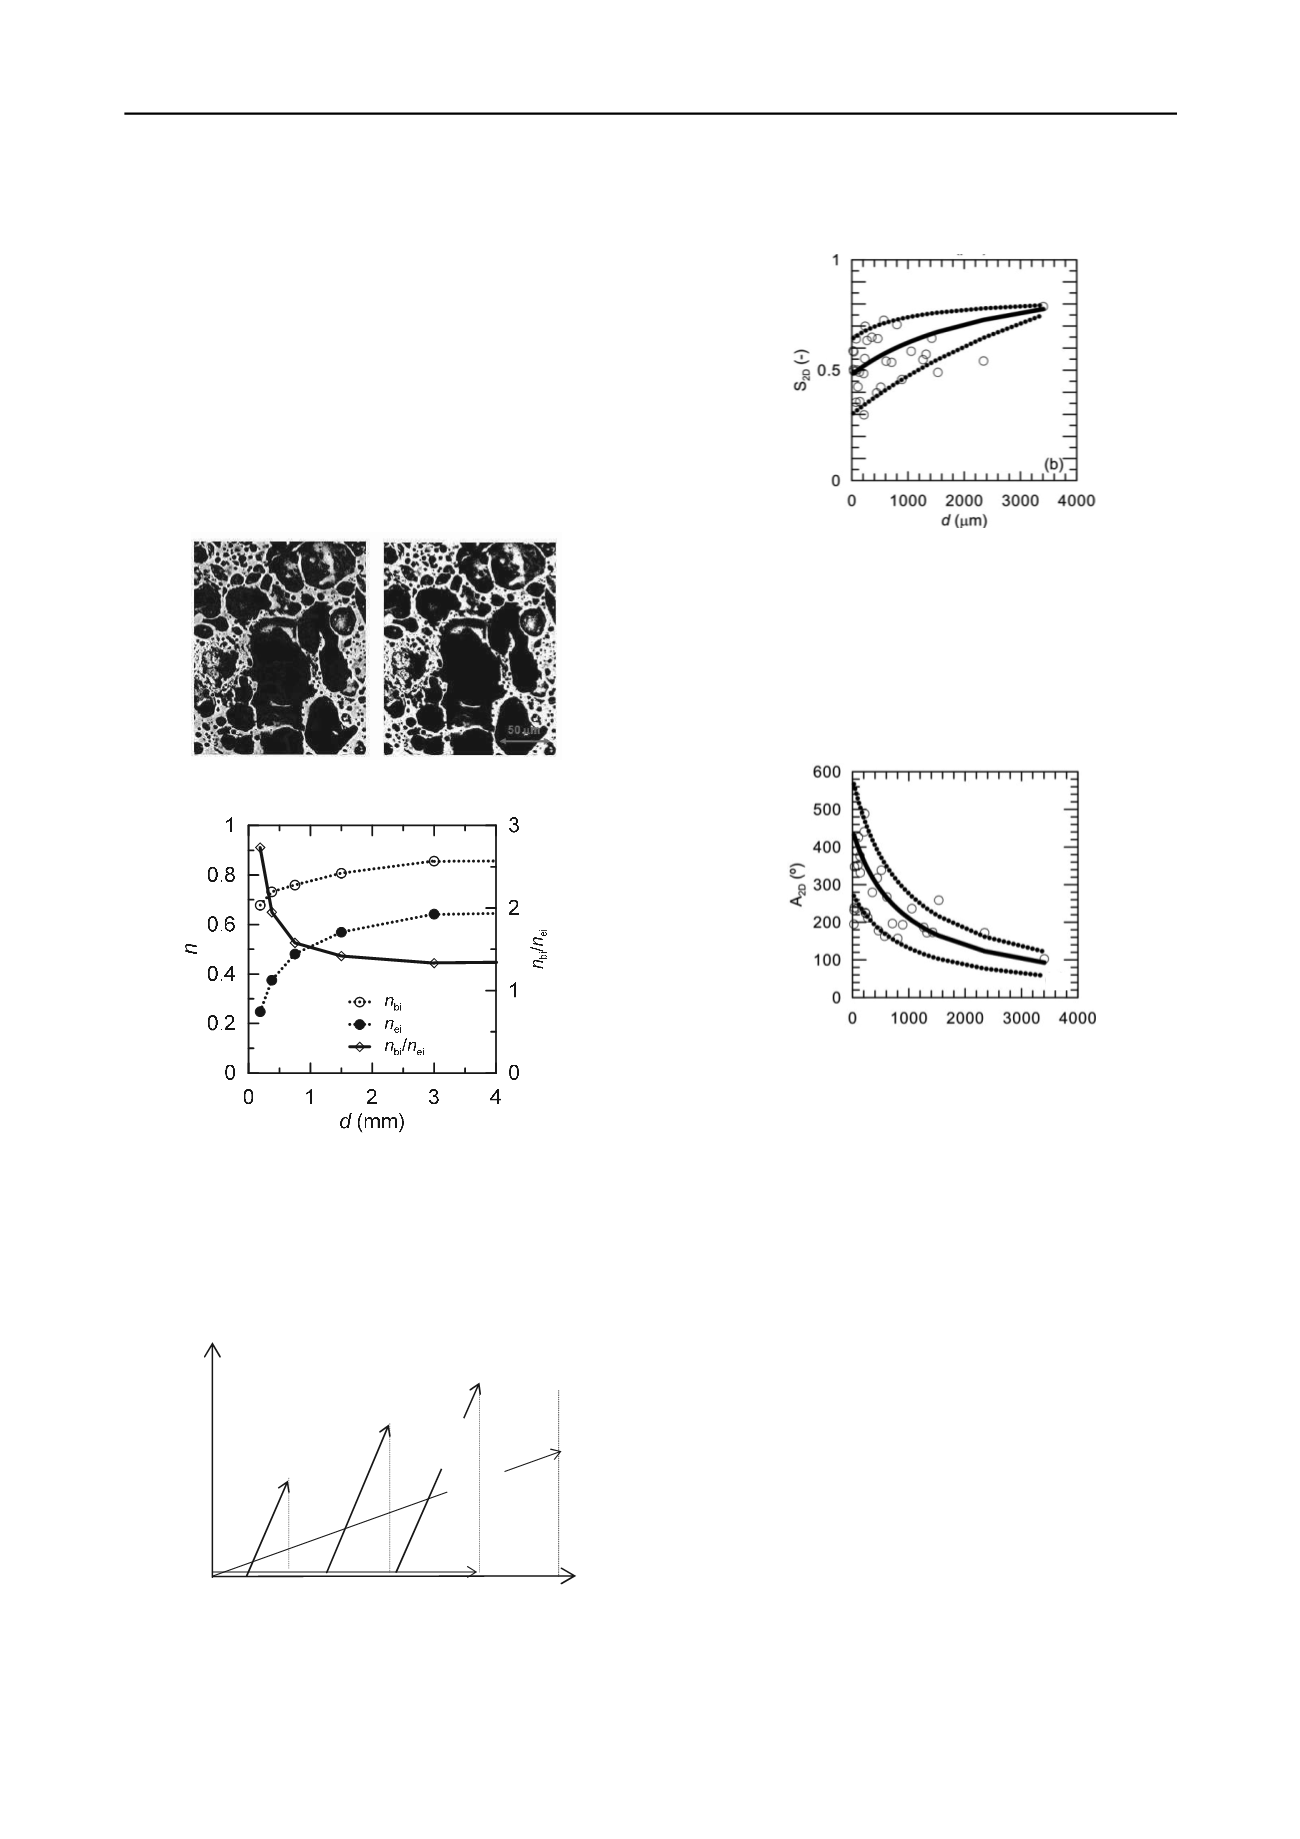
6b). The processed images were then imported in Matlab and
the number of white (
N
W
) and black (
N
B
) pixels counted with a
simple algorithm; it was then possible to attribute the exposed
intra-granular porosity of grains,
n
ei
=
N
B
/(
N
B
+
N
w
) to different
fractions. Figure 7 shows
n
ei
as a function of particle size,
together with the bulk intra-granular porosity,
n
bi
(= 1
as
/
s
),
obtained from the measurement of the apparent unit weight of
particles of different sizes,
as
. The exposed intra-granular
porosity is always smaller than the bulk intra-granular porosity
as the first is related to the ratio of the average void size to the
particle size squared, while the second is related to the same
ratio raised to a power 3. Both
n
ei
and
n
bi
increase with
increasing grain size, tending to constant values at particle sizes
larger than about 3.5 mm, where the apparent unit weight of the
particles,
as,
becomes constant, with a final ratio
n
ei
/
n
bi
1.3.
Figure 6. Intra-porosity detected through SEM processing
Figure 7. Exposed and bulk intra-granular porosity of crushed LECA
particles as a function of grain size.
2 EXPERIMENTAL PROGRAMMEThe samples were
subjected to isotropic, one dimensional and triaxial compression
Wanninger and Zwicker, 2010; Leu
et al.,
2011) at increasing
confining pressures (see Fig. 7).
Figure 7. Stress-paths followed in the laboratory tests.
2.1
Particle sphericity and angularity
Figure 8. 2D sphericity of crushed LECA as a function of grain size.
SEM micrographs were also used to determine 2D sphericity
and angularity of the different fractions systematically.
Following the suggestion of Cho
et al.
(2006), 2D sphericity,
S
2D,
was evaluated as the ratio between the diameter of the
smallest circle inscribed in the 2D projection of the particle
shape and the diameter of a larger circle that contains the whole
particle. It is logical that S
2D
will increase with particle diameter
due to surface texture (Fig. 8).
Figure 9. 2D angularity of crushed LECA as a function of grain size.
2D angularity (A
2D
) of the particles was determined using the
definition proposed by Miura
et al.,
1997. The values of A
2D
are
reported in Figure 9 as a function of particle diameter, where
A2D decreases as the particle diameter increases. It should be
mentioned that the angularity as evaluated above is a macro
angularity of the particles, while further investigations are
needed to evaluate the micro-angularity or smoothness of the
particles.
2.2
Evolution of grading
Figure 8 shows the cumulative grain size distribution by weight
obtained for the grading with
U
= 3.5 and d
50
= 0.5 mm at
increasing mean effective stress. The final grain size
distribution (GSD) is rotated upwards and translated leftwards,
with an increase of the fine fraction at an almost constant value
of the maximum particle size,
d
M
. The maximum particle size
d
M
is likely to be different from
n (maximum dimension of the
sieve series) and is unknown, even though
d
M
must always be
less than the sieve dimension
n. Small changes of
d
M
with load
and stress path are difficult to detect in the laboratory because
the spacing of two successive sieves around
d
M
is finite and not
fine enough. The experimental results have been fitted using the
equation
P
(%)=(
d
/
d
M
)
, represented by the dotted line in Figure
10, which fits the experimental results quite well.
OED
TX
C
ISO
1
2
3
4
mean effective stress,
p
′
de
via
tor
str
es
s,
q
d
(
m)
Proceedings of the 18
th
International Conference on Soil Mechanics and Geotechnical Engineering, Paris 2013
6b). The processed images were then imported in Matlab and
the number of white (
N
W
) and black (
N
B
) pixels counted with a
simple algorithm; it was then possible to attribute the exposed
intra-granular porosity of grains,
n
ei
=
N
B
/(
N
B
+
N
w
) to different
fractions. Figure 7 shows
n
ei
as a function of particle size,
together with the bulk intra-granular porosity,
n
bi
(= 1
as
/
s
),
obtained from the measurement of the apparent unit weight of
particles of different sizes,
as
. The exposed intra-granular
porosity is always smaller than the bulk intra-granular porosity
as the first is related to the ratio of the average void size to the
particle size squared, while the second is related to the same
ratio raised to a power 3. Both
n
ei
and
n
bi
increase with
increasing grain size, tending to constant values at particle sizes
larger than about 3.5 mm, where the apparent unit weight of the
particles,
as,
becomes constant, with a final ratio
n
ei
/
n
bi
1.3.
Figure 6. Intra-porosity detected through SEM processing
Figure 7. Exposed and bulk intra-granular porosity of crushed LECA
particles as a function of grain size.
2
EXPERIMENTAL PROGRAMMEThe samples were
subjected to isotropic, one dimensional and triaxial compression
Wanninger and Zwicker, 2010; Leu
et al.,
2011) at increasing
confining pressures (see Fig. 7).
Figure 7. Stress-paths followed in the laboratory tests.
2.1
Particle sphericity and angularity
Figure 8. 2D sphericity of crushed LECA as a function of grain size.
SEM micrographs were also used to determine 2D sphericity
and angularity of the different fractions systematically.
Following the suggestion of Cho
et al.
(2006), 2D sphericity,
S
2D,
was evaluated as the ratio between the diameter of the
smallest circle inscribed in the 2D projection of the particle
shape and the diameter of a larger circle that contains the whole
particle. It is logical that S
2D
will increase with particle diameter
due to surface texture (Fig. 8).
Figure 9. 2D angularity of crushed LECA as a function of grain size.
2D angularity (A
2D
) of the particles was determined using the
definition proposed by Miura
et al.,
1997. The values of A
2D
are
reported in Figure 9 as a function of particle diameter, where
A2D decreases as the particle diameter increases. It should be
mentioned that the angularity as evaluated above is a macro
angularity of the particles, while further investigations are
needed to evaluate the micro-angularity or smoothness of the
particles.
2.2
Evolution of grading
Figure 8 shows the cumulative grain size distribution by weight
obtained for the grading with
U
= 3.5 and d
50
= 0.5 mm at
increasing mean effective stress. The final grain size
distribution (GSD) is rotated upwards and translated leftwards,
with an increase of the fine fraction at an almost constant value
of the maximum particle size,
d
M
. The maximum particle size
d
M
is likely to be different from
n (maximum dimension of the
sieve series) and is unknown, even though
d
M
must always be
less than the sieve dimension
n. Small changes of
d
M
with load
and stress path are difficult to detect in the laboratory because
the spacing of two successive sieves around
d
M
is finite and not
fine enough. The experimental results have been fitted using the
equation
P
(%)=(
d
/
d
M
)
, represented by the dotted line in Figure
10, which fits the experimental results quite well.
OED
TX
C
ISO
1
2
3
4
mean effective stress,
p
′
de
via
tor
str
es
s,
q
d
(
m)
r
i
f t
th
I t r ti
l
f r
il
i
t
i l
i
ri ,
ris
b). The processed images were then imported in Matlab and
th
b r f ite ( )
l
( ) i ls
t
it
si l l rit m; it as t e possible to attribute the expose
intr - r l r por sity of gr i s,
n
ei
=
N
B
/(
N
B
+
N
) to diff r t
fr ti s. ig r
s ws
ei
s functi n f rti le size,
togeth r it t e ulk i tr - r l r r sit ,
bi
(
as
/
s
),
obtained from the m asur
t f the ppar t nit w i t f
particles of different si s,
as
.
s intra- r l r
rosity is always smaller t
t
ul i tra-granul r r sit
s t first is related to the r ti f t
r
i si t t
article size squared, while the s cond is r l t t t
r ti r ise t
r 3. B t
ei
an
bi
i cr s it
in r si
rai si , tending to constant valu s t rti le si s
larger than about 3.5 mm, where the apparent nit
i ht of t
particles,
as,
s st t, it
fi l r ti
ei
/
bi
. .
i re . I tra- r sit etecte t r h
r cessi
igure 7. xp sed an l intra- ra lar r sit of crushed
articles as a f cti
f rai size.
I
s l s r
subjected to isotropic, one dimensional and triaxial compression
i
r
Z i er, 2010; e
et l.,
) t i r si
confining pressures (see Fig. 7).
i r . tr ss- t s f ll
i t l
r t r t sts.
2.1
Particle sphericit
l rit
i ure .
s ericit f cr s e
as a fu cti n f rain size.
SEM micrograp s ere also se t
t r i
s ri it
a gul rit
f the diff r t fracti s s ste ti all .
ll i
the suggestion of Ch
t al.
( 06), 2 s ri ity,
S
2 ,
s alu ted s t
r ti bet
t
iam t r f t
smallest circle inscribed in the 2D projection of th rti le
shape and the diameter of a larger circle that contains the whol
rti l . It is logical t at S
2
ill i r se it articl i eter
due to surface texture ( i . ).
i ure .
a larit f cr s e
as a fu ction f rain size.
2D angularity (A
2
) f t
rticles w s termi
si t
efiniti
r os d i r
t l.,
7.
al es f
2
r
r rt i
i r
f ti
f rti l i
t r,
r
A2D decreases as the particle dia t r i r s s. It s l
entioned that the angul rit s l t
is
r
angularity of the particles, while f rt r i
ti ti s r
needed to e l t t
i r -
l rit
r s t
ss f t
parti l s.
.
l tion of grading
i re 8 shows the cumul ti e r i si e istrib tio y i t
obtained for the grading with
U
= 3.5 and d
50
= 0.5 mm at
incr asi g ea effe tive str ss.
fi l
r i
si
distribution (GSD) is rotate pw r s
tr sl t left ar s,
it
i r s f t e fi fr ti
t a l st c st t v lu
of the maximum particle size,
d
. The maximum rti le size
is likely to be different fr
( a i
i
si
f t
sieve series) and is unknown, e th
st l
s
less t
t si
dime si n . mall c a es of
M
with l
and stress pat r iffi lt t
t t i t l
r t r
s
the s i
f t
s essive si s ar d
d
is fi it
t
fine e
.
ri ental results
en fitte si t
equation
P
(%)=(
d
/
d
)
, represented by the dotte li i i r
,
i fits t
ri
t l r s lts quite well.
I
1
2
3
ff ti
tr ,
′
i
tor
str
,
q
d
(
m)


