213
        
        
          Technical Committee 101 - Session I /


            Comité technique 101 - Session I


            Proceedings of the 18


            th


            International Conference on Soil Mechanics and Geotechnical Engineering, Paris 2013


          Tab.2 Initial physical parameters and stress states of samples before soaking
        
        
          6
        
        
          5
        
        
          4
        
        
          3
        
        
          2
        
        
          1
        
        
          80
        
        
          10 9 8.67
        
        
          9
        
        
          14
        
        
          12.67
        
        
          16.67
        
        
          39.1
        
        
          Figure 5. Scanning position (length unit: mm)
        
        
          Figure 6 Scanning images of 5
        
        
          th
        
        
          section of sample 3
        
        
          #
        
        
          of Q
        
        
          3
        
        
          loess
        
        
          during loading
        
        
          Tab.3 CT data and stress state of sample 3# during loading
        
        
          5
        
        
          th
        
        
          Section
        
        
          Stress state
        
        
          Scan
        
        
          sequence
        
        
          H
        
        
          SD
        
        
          Initial state
        
        
          a
        
        
          821.1
        
        
          49.4
        
        
          End of
        
        
          consolidation
        
        
          b
        
        
          854.6
        
        
          44.7
        
        
          q = 25 kPa
        
        
          c
        
        
          856.5
        
        
          44.7
        
        
          q = 50 kPa
        
        
          d
        
        
          852.7
        
        
          41.4
        
        
          q = 75 kPa
        
        
          e
        
        
          854.1
        
        
          42.6
        
        
          q = 100 kPa
        
        
          f
        
        
          854.0
        
        
          41.7
        
        
          q = 150 kPa
        
        
          g
        
        
          887.0
        
        
          45.9
        
        
          q = 200 kPa
        
        
          h
        
        
          927.2
        
        
          43.4
        
        
          4 STRUCTURE EVOLUTION OF LOESS Q
        
        
          3
        
        
          Collapsibility is the most important feature of loess.
        
        
          However, collapsibility depends on the meso-structure of loess.
        
        
          In order to discover the characteristics of the meso-structure
        
        
          evolution of loess, 10 groups of CT-triaxial tests including 49
        
        
          samples of Q
        
        
          3
        
        
          loess were conducted. A total of 847 CT images
        
        
          and a number of CT data were obtained (Zhu, 2007; Fang,
        
        
          2008; Li, 2010).


            4.1 The structure evolution of Q


            3


            loess during loading and


            collapsing


          Six tests of intact Q
        
        
          3
        
        
          loess were conducted. The size of samples
        
        
          was 39.1mm in diameter and 80mm in height. The initial
        
        
          conditions and test parameters of the samples are shown in table
        
        
          2. Each sample was scanned 6 sections (Figure 5), and each
        
        
          section was scanned from 6 to 8 times. The scanning pictures
        
        
          were marked as a, b, c, d, e, f, g and h corresponding to a
        
        
          section in successive scanning (Zhu, 2008a). A total of 273 CT
        
        
          images were obtained.
        
        
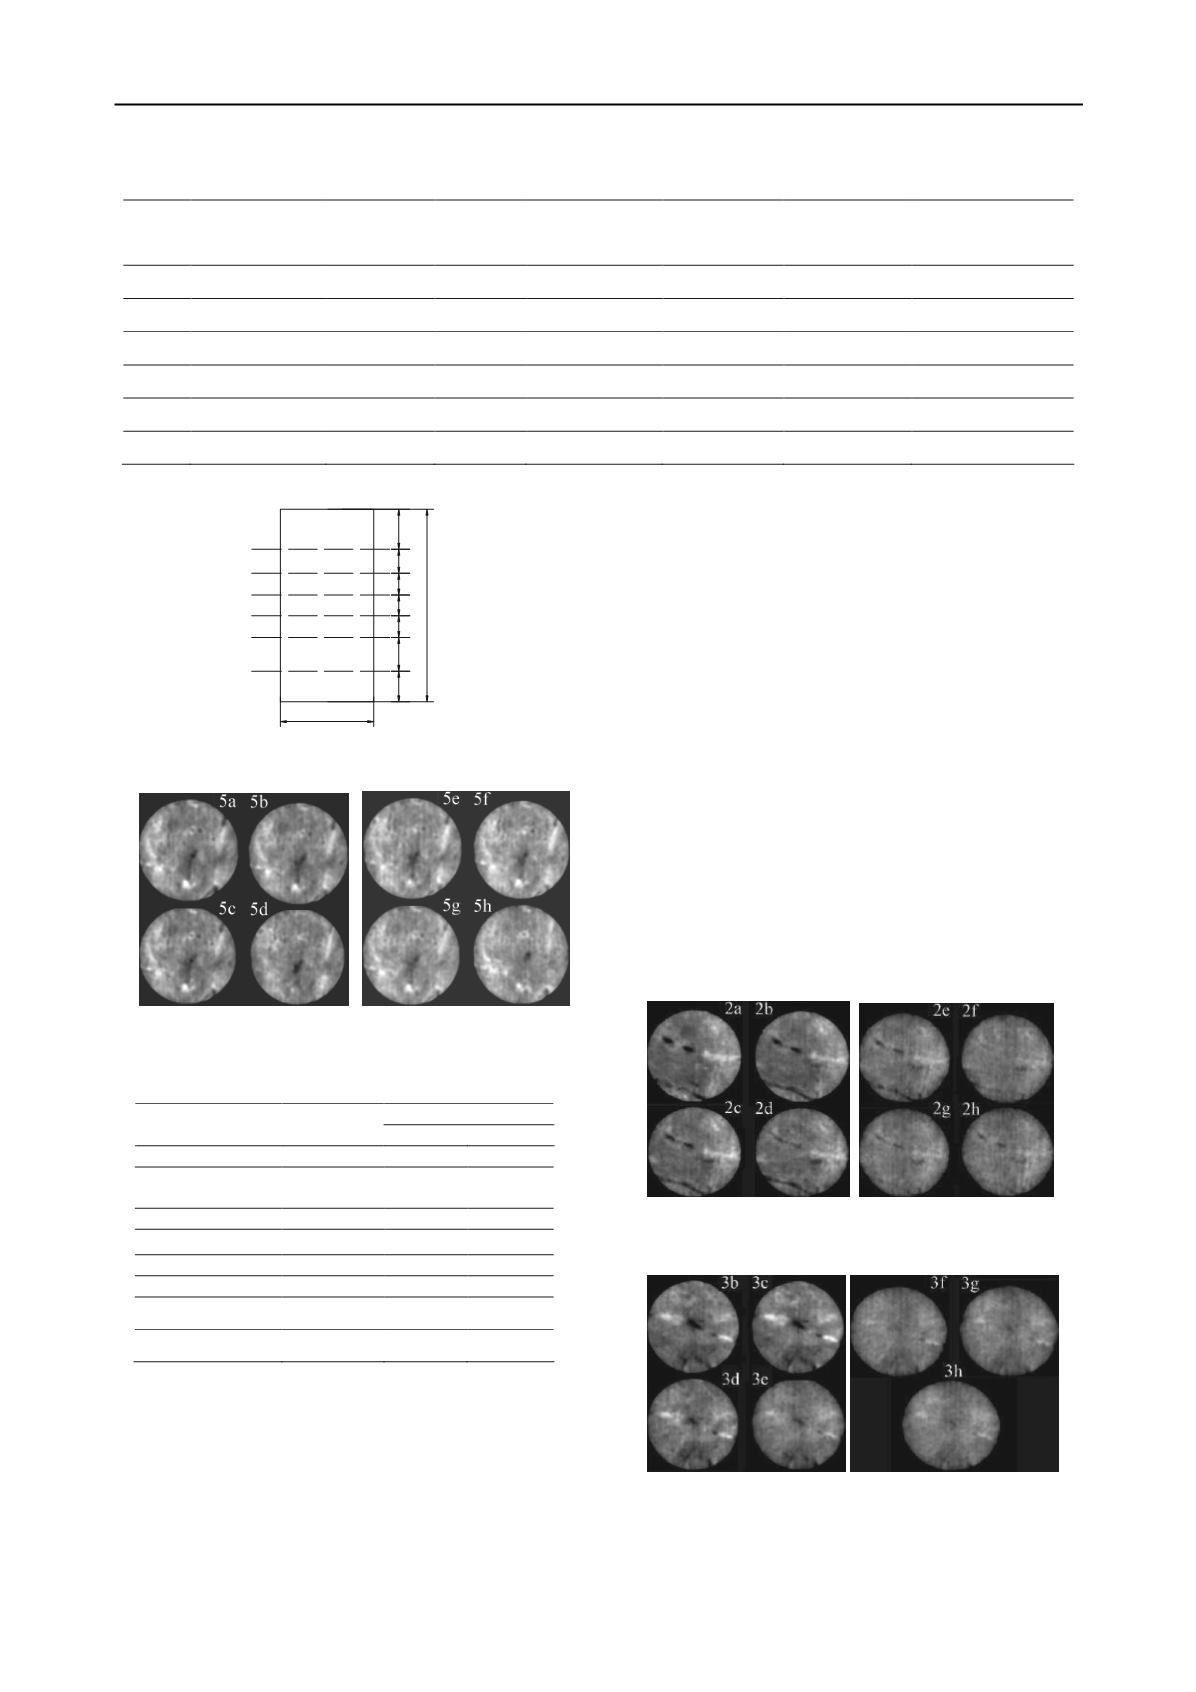
          Figure 6 shows the Scanning images of 5
        
        
          th
        
        
          section of sample
        
        
          3
        
        
          #
        
        
          of Q
        
        
          3
        
        
          loess during loading. The scanning pictures were
        
        
          marked as a, b, c, d, e, f, g and h corresponding to the initial
        
        
          state, the end of consolidation, and deviator stress ( q ) equal to
        
        
          25
        
        
          ,
        
        
          50
        
        
          ,
        
        
          75
        
        
          ,
        
        
          100
        
        
          ,
        
        
          150 and 200 kPa of the 5
        
        
          th
        
        
          section (
        
        
          Table
        
        
          3)
        
        
          . H and SD in table 3 are the mean value and the standard
        
        
          deviation of CT data of the 5
        
        
          th
        
        
          section.
        
        
          It is clear from Figure 6 and
        
        
          Table 3
        
        
          that consolidation has
        
        
          significant effect on the meso-structure of sample, and there is
        
        
          no evident change in the meso-structure of sample 3
        
        
          #
        
        
          before
        
        
          deviator stress less than 150 kPa. In addition, the defect region
        
        
          (black part in Figure 6) not vanishes completely at the end of
        
        
          loading.
        
        
          Figure 7 Scanning images during triaxial collapse of
        
        
          2nd section of sample 4# of intact Q3 loess
        
        
          Fig.8 Scanning images during triaxial collapse of
        
        
          3rd section of sample 4# of intact Q3 loess
        
        
          No.of
        
        
          sample
        
        
          Initial dry density
        
        
          g / cm
        
        
          3
        
        
          Initial water
        
        
          content /% Void ratio
        
        
          Net cell pressure
        
        
          3
        
        
          - )


            a


            u


          (
        
        
          / kPa
        
        
          Matric suction
        
        
          s / kPa
        
        
          Deviator stress
        
        
          q / kPa
        
        
          Water pressure
        
        
          during soak / kPa
        
        
          1
        
        
          1.31
        
        
          11.0
        
        
          1.08
        
        
          100
        
        
          150
        
        
          0
        
        
          4
        
        
          2
        
        
          1.31
        
        
          11.0
        
        
          1.08
        
        
          200
        
        
          150
        
        
          0
        
        
          12
        
        
          3
        
        
          1.32
        
        
          11.0
        
        
          1.04
        
        
          100
        
        
          150
        
        
          200
        
        
          14
        
        
          4
        
        
          1.32
        
        
          11.0
        
        
          1.05
        
        
          100
        
        
          250
        
        
          0
        
        
          12
        
        
          5
        
        
          1.31
        
        
          11.0
        
        
          1.06
        
        
          100
        
        
          150
        
        
          100
        
        
          14
        
        
          6
        
        
          1.30
        
        
          11.0
        
        
          1.08
        
        
          100
        
        
          150
        
        
          250
        
        
          14