221
Technical Committee 101 - Session I /
Comité technique 101 - Session I
Proceedings of the 18
th
International Conference on Soil Mechanics and Geotechnical Engineering, Paris 2013
procedure lasting 7, 14 and 21 days for three series of testing,
specimens were sheared in the shearing stage by the same rate
of shearing. Normal stress levels remained unchanged in both
stages.
3.2
Test results
Measured vertical displacements in the shear stage indicate
consolidation under all normal stress levels and hydration times.
The displacement rate in these tests was 1 mm/min and the
assumption was that compression during the shear would cause
pore pressure inside the specimen to increase.
Table 1 shows the results of testing in the shear stage.
Residual values of shear strength were obtained at specimen
relative deformation of 15%, and this was also the maximum
horizontal shear that could be obtained in the standard shear
box. Shear strength values were constantly growing with the
increase of normal stress and with decrease of final moisture
content. With specimens subjected to stress levels of 50 and 100
kPa, longer hydration times caused higher values of final
moisture content and decreasing shear strengths. With
specimens subjected to stress level of 200 kPa, final moisture
content and shear strength of bentonite did not change
irrespectively on hydration times.
Table 1. Summary of direct shear test results.
Shear strength
Hydration
time
Normal
stress
(kPa)
Peak
(kPa)
Residual
(kPa)
Final moisture
content
(%)
7 days
50
21.4
17.3
113.12
14 days
50
19.4
12.9
124.32
21 days
50
17.2
11.8
140.26
7 days
100
32.2
25.6
85.36
14 days
100
29.2
21.4
97.82
21 days
100
27.5
20.0
104.05
7 days
200
51.1
38.0
71.33
14 days
200
52.0
37.6
69.66
21 days
200
49.4
36.2
71.91
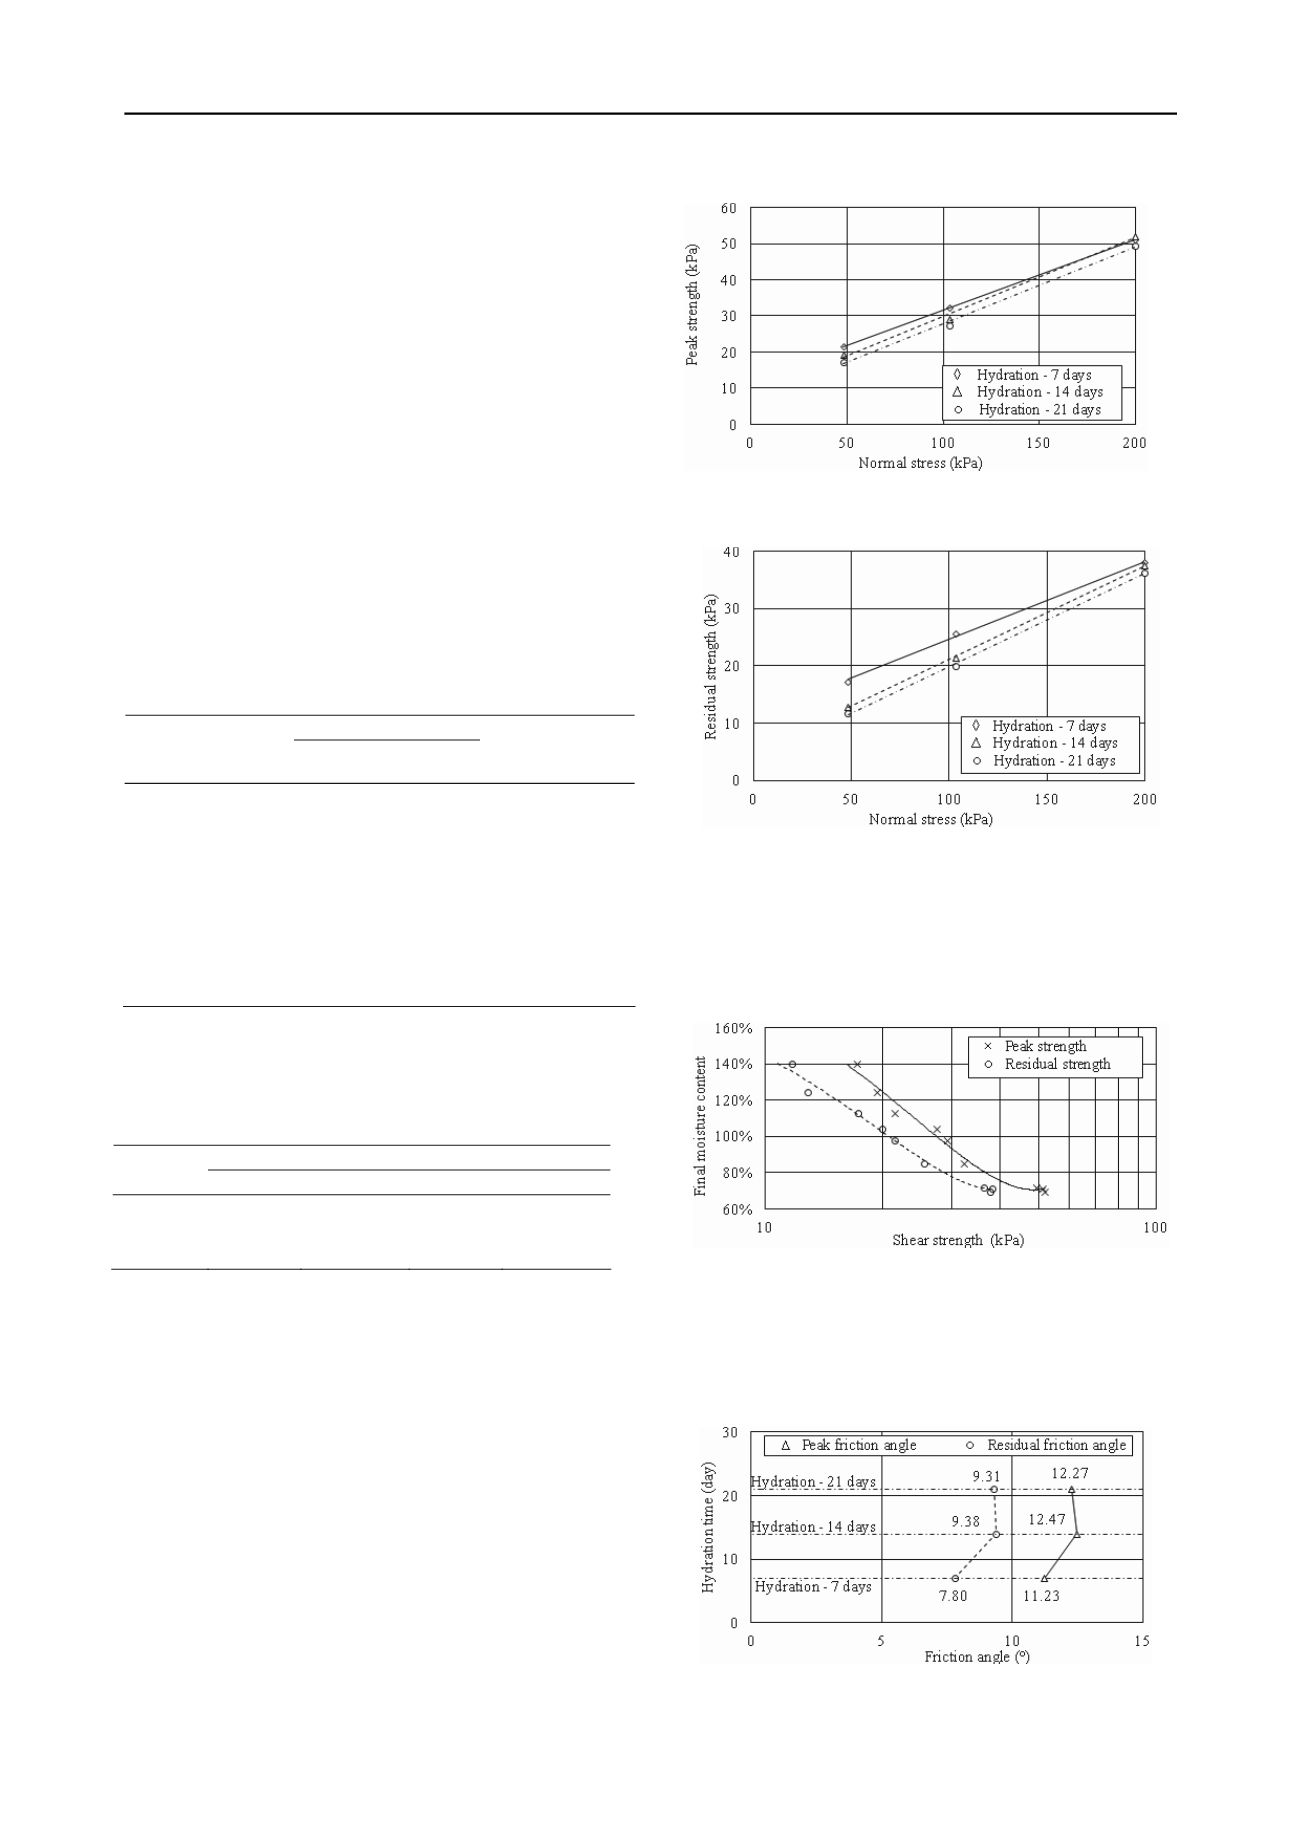
Table 2 shows the value of shear strength parameters obtained
by shearing of bentonite specimens. Peak and residual strength
envelopes are shown in Figures 2 and 3.
Table 2. Shear strength parameters.
Peak parameters
Residual parameters
Hydration
time
c (kPa)
(°)
c (kPa)
(°)
7 days
11.99
11.23
11.05
7.80
14 days
8.04
12.47
4.79
9.38
21 days
6.32
12.27
3.63
9.31
By observing peak (Figure 2) and residual (Figure 3)
strength envelopes, it is evident that the specimens sheared after
14 and 21 days of hydration have almost identical values of
peak and residual friction angle, while peak and residual values
of cohesion were decreasing as specimen hydration times were
increased. In the case of specimen hydrated for seven days,
there was obvious change in behavior, in comparison with
specimens hydrated for 14 and 21 days. This specific specimen
shows significantly higher values for peak and residual cohesion
and somewhat lower values for peak and residual friction angle,
in comparison to specimens hydrated for 14 and 21 days.
Figure 2. Peak strength envelopes.
Figure 3. Residual strength envelopes.
Figure 4 presents the influence of final moisture content on the
test result values for peak and residual shear strength. It is
evident that, irrespectively to the normal stress level, shear
strength has tendency to decrease as final moisture content
increases.
Figure 4. Final moisture content vs. shear strength.
Figure 5 presents the correlation between peak and residual
friction angles and the time of hydration. For hydration times in
this test, a change in the friction angle was visible up to the 14th
day of hydration. After that, the friction angle decreased
insignificantly.
Figure 5. Hydration time vs. friction angle.


