222
Proceedings of the 18
th
International Conference on Soil Mechanics and Geotechnical Engineering, Paris 2013
Proceedings of the 18
th
International Conference on Soil Mechanics and Geotechnical Engineering, Paris 2013
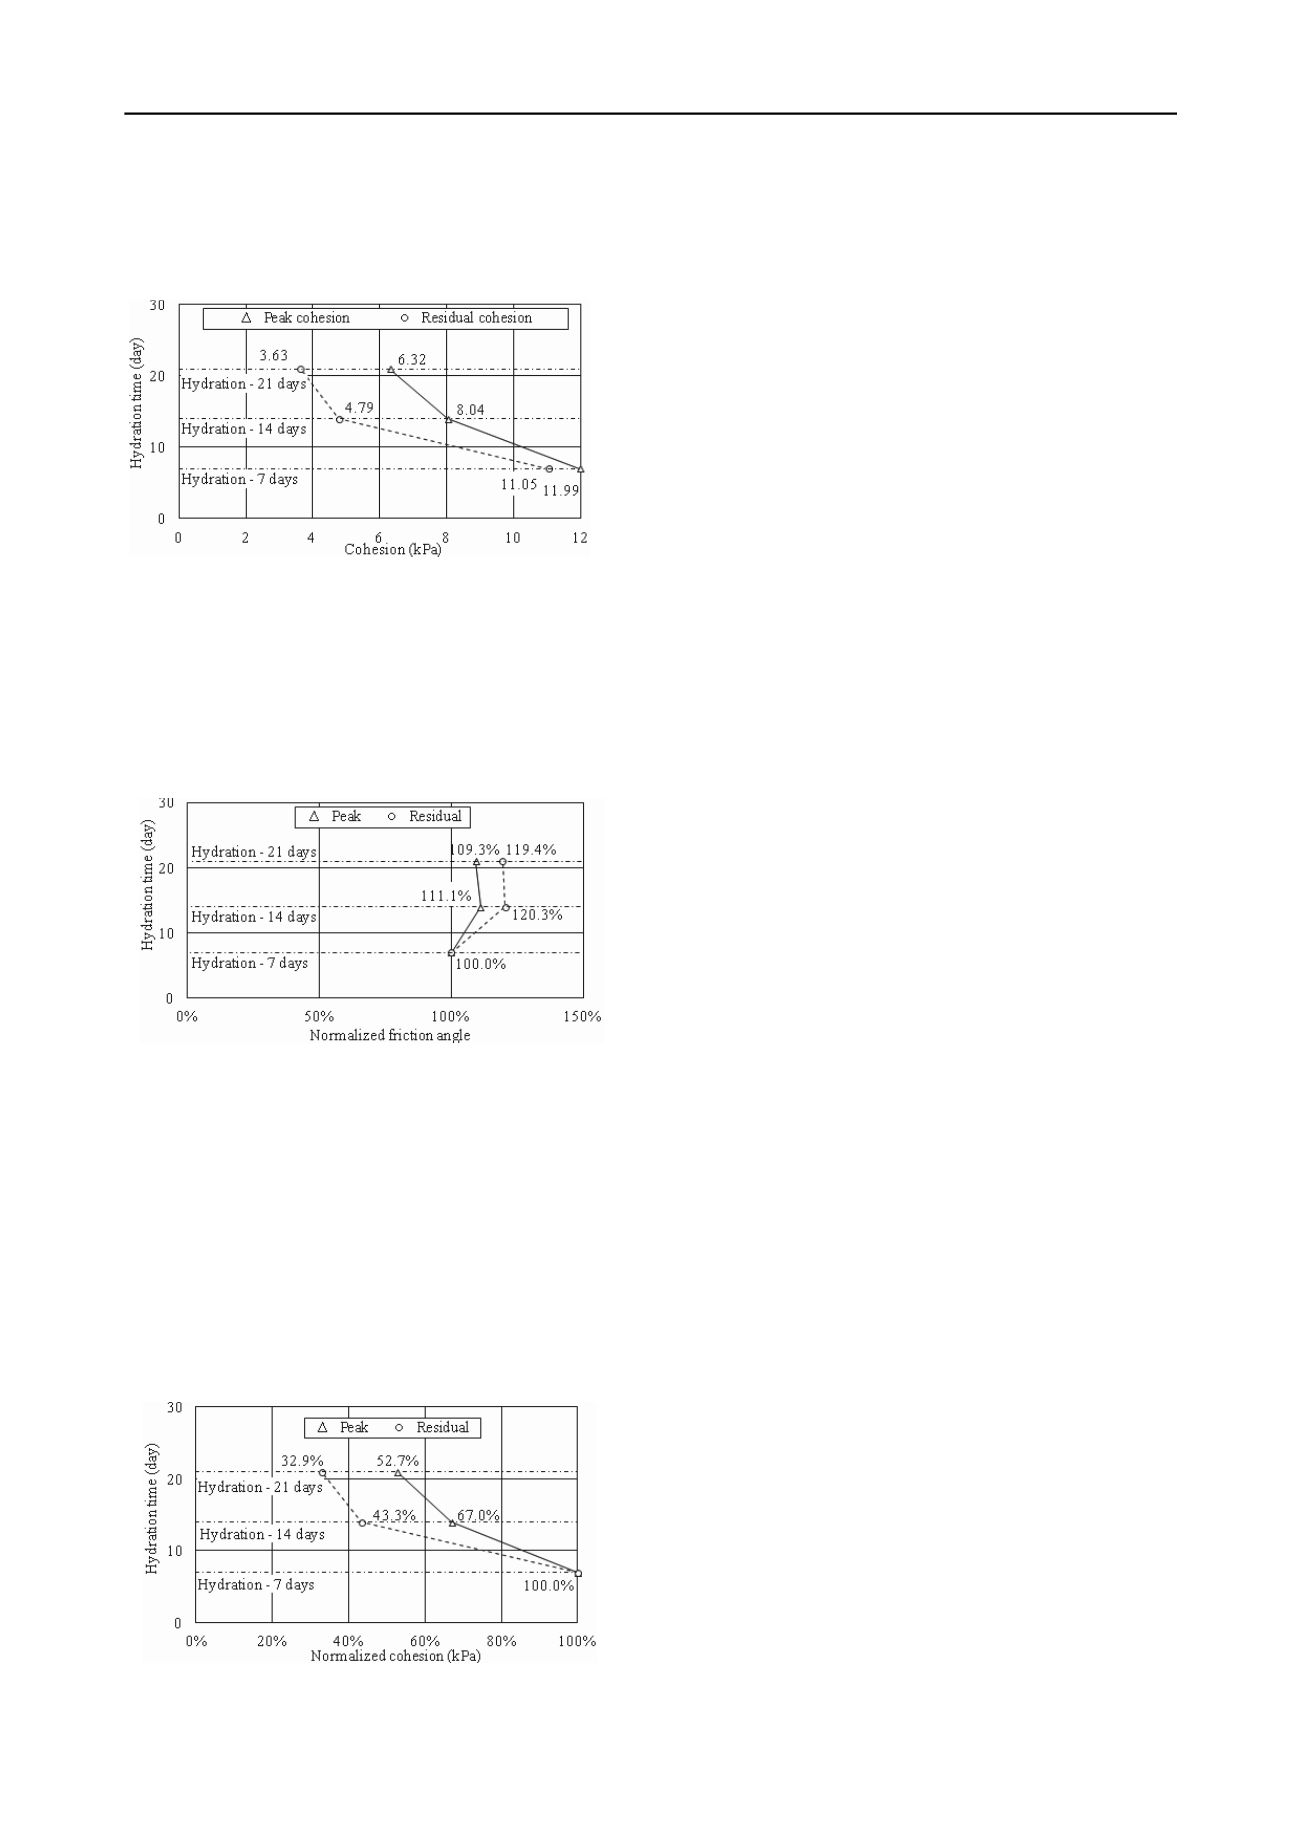
Figure 6 presents the correlation between peak and residual
cohesion and the time of hydration. Observing the change in
cohesion, it is evident that cohesion decreases constantly with
longer hydration times.
4
CONCLUSIONS
Test results show that the swelling of bentonite clay is a long-
lasting process. Tests carried out on the Volclay sample have
shown that the primary swelling stage is completed after 31
days, regardless of the normal stress intensity. After primary
swelling, the stage of secondary compression and creep
develops. The extent of swelling and secondary compression
depends on the normal stress levels.
The analysis of shear strength parameters of specimens hydrated
for 7, 14 and 21 days shows decreasing cohesion with extended
times of hydration. When hydration time is longer than 14 days,
the intensity of change in cohesion decreases. The intensity of
change in residual cohesion in the first 14 days of hydration is
higher than for peak values, presumably as a result of increasing
pore pressure during the shear stage.
Figure 6. Hydration time vs. cohesion.
Friction angle and cohesion values were normalized and
expressed in percentages in relation to the parameter values
after seven days of hydration. It is evident that a 14-day
hydration causes peak friction angle to increase by around 10%,
while extended hydration time results in insignificant decrease
of the friction angle (Figure 7). The increase is higher with the
residual friction angle – by around 20% after 14 days of
hydration, while after that it decreases insignificantly.
With extended hydration time (from 7 to 14 days), the friction
angle initially increases, but further extension of hydration (to
more than 14 days) produces almost no change in the friction
angle value. Peak and residual friction angles change in line
with this pattern, but the extent is somewhat smaller for the
residual friction angle.
Knowing the process of swelling of bentonite is important from
the aspect of shear strength of bentonite and clay geosynthetic
barriers. Also, the displacement rate influences peak and
residual values of bentonite shear strength. Lower displacement
rate means a longer test duration overall, and consequently more
time for hydration/swelling in case of normal stress levels that
are smaller than the bentonite swelling pressure. Potential
continuation of the hydration process in the shearing stage will
depend on the stage of swelling that the specimen is in. If the
time required to finalize primary swelling has been reached, it
can be assumed that hydration of the specimen would end, and
that after this the specimen would enter the stage of secondary
compression
5
ACKNOWLEDGMENTS
Figure 7. Hydration time vs. normalized friction angle.
Cohesion values continuously decrease with the increase of
hydration time, and this is particularly evident with residual
cohesion, where this reduction is more obvious (Figure 8).
Specifically, the value of peak cohesion equals 67% of
normalized value (in comparison to 7-day hydration) after 14
days of hydration and 52.7% after 21 days of hydration; the
value of residual cohesion equals 43.3% of normalized value,
which is by 13.7% higher reduction in residual cohesion. After
21 days of hydration, the value of residual cohesion equals
32.9% of normalized value, which is by 9.8% less in
comparison with peak cohesion.
This paper was produced with financial support from the
Croatian Ministry of Science, Education and Sports, through a
project "Long-term performance of mineral barriers"; 195-
0831529-1847.
6
REFERENCES
Mitchell J. K. and Soga K. (2005): Fundamentals of Soil Behavior, John
Wiley and Sons, New York
Shackelford, C. D., Benson, C. H., Katsumi, T., Edil, T. B. and Lin, L.
(2000): Evaluating the hydraulic conductivity of GCLs permeated
with non-standard liquids, Geotextiles and Geomembranes, 18 (2–
4), 133–162.
Shackelford, C. D., Sevick, G. W. and Eykhol, G. R. (2010): Evaluating
the hydraulic conductivity of GCLs permeated with non-standard
liquids, Geotextiles and Geomembranes, 18, 133–162.
Zornberg, J. G. and McCartney, J. S. (2009): Chapter 8: Internal and
interface shear strength of geosynthetic clay liners, In: GCLs for
Waste Containment, Bouazza, A. & Bowders, J.J. (Ed), CRC Press.
Kovačević Zelić, B. (2000): Ispitivanje posmične čvrstoće bentonitnih
tepiha, Doktorska disertacija, RGN-fakultet, Zagreb.
Guyonnet, D., Touze Foltz, N., Norotte, V., Pothier, C., Didier, G.,
Gailhanou, H., Blanc, P. and Warmont, F. (2009): Performance-
based indicators for controlling geosynthetic clay liners in landfill
applications; Geotextiles and Geomembranes 27, 321–331.
Fox, P. J. (2010): Internal and interface shear strengths of geosynthetic
clay liners, 3rd Int. Symp. on GCLs, 15-19.9.2010, Germany,
Zanzinger, H., Koerner , R. M. & Touze-Foltz, N. (Eds.), 203-218.
Gilbert, R. B., Fernandez, F. F. and Horsfield, D. (1996): Shear strength
of a reinforced clay liner, Journsl of Geot. and Geoenv. Eng., 122,
259-266.
Bouazza, A. (2002): Geosynthetic Clay Liners, Geotextiles and
Geomembranes 20, Elsevier Science.
Figure 8. Hydration time vs. normalized cohesion.


