201
Technical Committee 101 - Session I /
Comité technique 101 - Session I
Proceedings of the 18
th
International Conference on Soil Mechanics and Geotechnical Engineering, Paris 2013
Although the fissures are sealed due to hydration of clay
minerals, these discontinuities have much lower tensile
strengths than the soil aggregates (Azam and Wilson 2006).
This led to a quick drainage through these paths of least
resistance. Subsequent application of suction affected the soil
aggregates and eventually forced air to enter into the pore
system of the aggregate. The upward SWCC shift of the
compacted sample with respect to the in situ sample is attributed
to the high initial water content of the former sample. Upon
water inundation, this sample favored particle hydration because
of a comparatively looser state (
e
= 1.18). Likewise, the
relatively homogeneous structure of the compacted sample
correlated well with its smaller difference between the two air
entry values. The effect of soil structure was eliminated when
the two curves merged at higher suction. Desaturation occurred
at an increased rate up to residual suction of 2000000 kPa (
w
=
5%) and the curves finally joined the abscissa at 10
6
kPa.
10
0
10
1
10
2
10
3
10
4
10
5
10
6
Soil Suction (kPa)
0
10
20
30
40
50
Gravimetric Water Content (%)
In situ soil
Compacted soil
Fissure
AEV
Matrix
AEV
Matrix AEV
Fissure AEV
Figure 1. SWCC with gravimetric water content
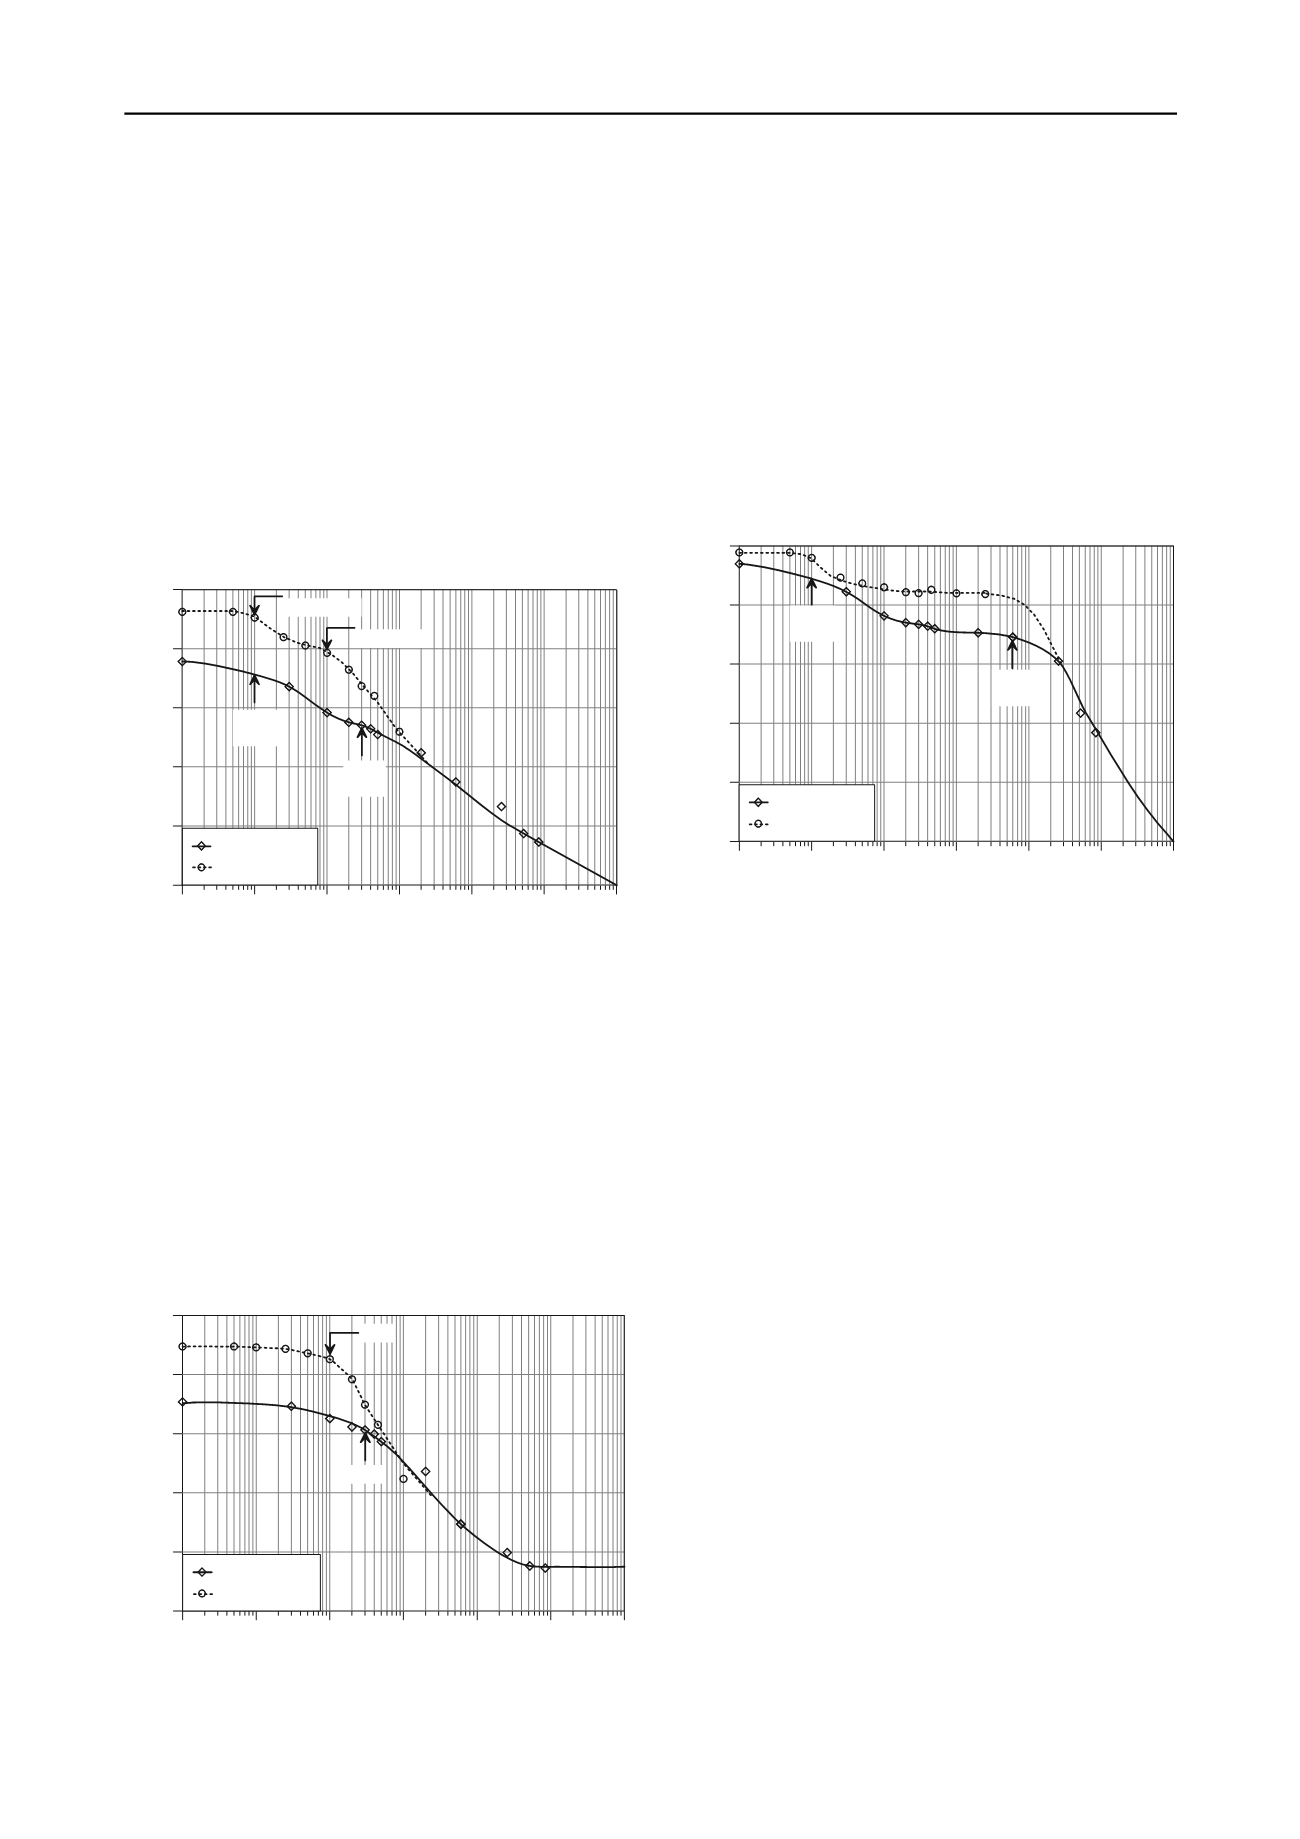
Figure 2 presents the SWCC in the form of void ratio as a
function of soil suction. The measured data closely followed
unimodal distributions showing a single air entry value (300
kPa for the in situ sample and 100 kPa for the compacted
sample). The latter sample plotted at a higher void ratio at low
suction and merged with the in situ sample at 500 kPa.
Thereafter, the singular curve exhibited a sharp decrease in void
ratio up to the residual condition, became asymptotic to the
abscissa after the residual suction and never reporting to 10
6
kPa
on complete drying. This is because void ratio of a soil pertains
to an average value for all voids and does not differentiate
between inter-aggregate fissures and intra-aggregate pores.
Clearly, SWCC representation in the form of void ratio is not
suitable for expansive soils.
10
0
10
1
10
2
10
3
10
4
10
5
10
6
Soil Suction (kPa)
0.4
0.6
0.8
1
1.2
1.4
Void Ratio
In situ soil
Compacted soil
AEV
AEV
Figure 2. SWCC with void ratio
Figure 3 gives the SWCC in the form of degree of saturation
versus suction. Similar to Figure 1, the laboratory measured
data depicted a bimodal function with a fissure air entry value
of 10 kPa. For the in situ sample, the average degree of
saturation decreased due to drainage through fissures and
reached about 70% when most of the fissures were filled with
air. The corresponding saturation for the compacted sample was
found to be around 85% indicating the presence of relatively
smaller and less frequent discontinuities. Once the fissures were
desaturated, water flow had to occur through voids in the soil
aggregates. Microporous drainage required a high suction (6000
kPa) for air to enter into the soil matrix. In contrast to Figure 1,
the significantly higher matrix air entry value in this figure is
attributed to the gradual decrease in soil volume with increasing
suction. As explained later, this volume reduction is primarily
due to reduced fissure sizes and, as such, was not captured in
Figure 2 that is based on an average void ratio.
10
0
10
1
10
2
10
3
10
4
10
5
10
6
Soil Suction (kPa)
0
20
40
60
80
100
Degree of Saturation (%)
In situ soil
Compacted soil
Fissure
AEV
Matrix
AEV
Figure 3. SWCC with degree of saturation
The SWCC given in the form of water content versus matric
suction is the most accurate representation for expansive soils.
This is because gravimetric water content (measured for each
suction value) captures the water drainage through fissures and
is independent of volume changes due to water adsorption by
clay particles. Likewise, the SWCC represented in the form of
degree of saturation versus soil suction is most suitable for
understanding volume decrease in fissures due to suction
application. Marinho (2005) reported that for plastic soils,
drainage through water filled pores is associated with pore
compressibility due to capillarity and this phenomenon renders
such soils to remain saturated over higher suction values. This
representation implies that the expansive soil aggregates remain
saturated over a wider range of suction generally prevalent in
the field, as postulated by Fityus and Buzzi (2008).
Figure 4 shows the shrinkage curve for the investigated
expansive clay. Theoretical lines representing various average
saturation degrees were obtained from basic phase relationships
and using
G
s
= 2.75. The initially unsaturated samples were first
wetted to achieve close to saturation conditions and
subsequently desaturated by applying different suction values.
The void ratio and water content of each sample were
determined as described earlier in this paper. The data depicted
in Figure 4 indicate S-shaped shrinkage curves for both sample
types and represent the progressive drying of the investigated
expansive soil. The curves are composed of an initial low
structural shrinkage followed by a sharp decline during normal
shrinkage and then by a low decrease during residual shrinkage
(Haines, 1923). During structural shrinkage, water within the
fissures and some of the larger and relatively stable voids is
removed such that the decrease in soil volume is less than the
volume of water lost. Volume decrease in soil is equal to the
volume of water lost during normal shrinkage thereby leading to
a 45
o
straight line, which is almost parallel to the 100%
saturation line. This suggests that drainage primarily takes place
through the soil matrix in the normal shrinkage zone. During


