194
Proceedings of the 18
th
International Conference on Soil Mechanics and Geotechnical Engineering, Paris 2013
Proceedings of the 18
th
International Conference on Soil Mechanics and Geotechnical Engineering, Paris 2013
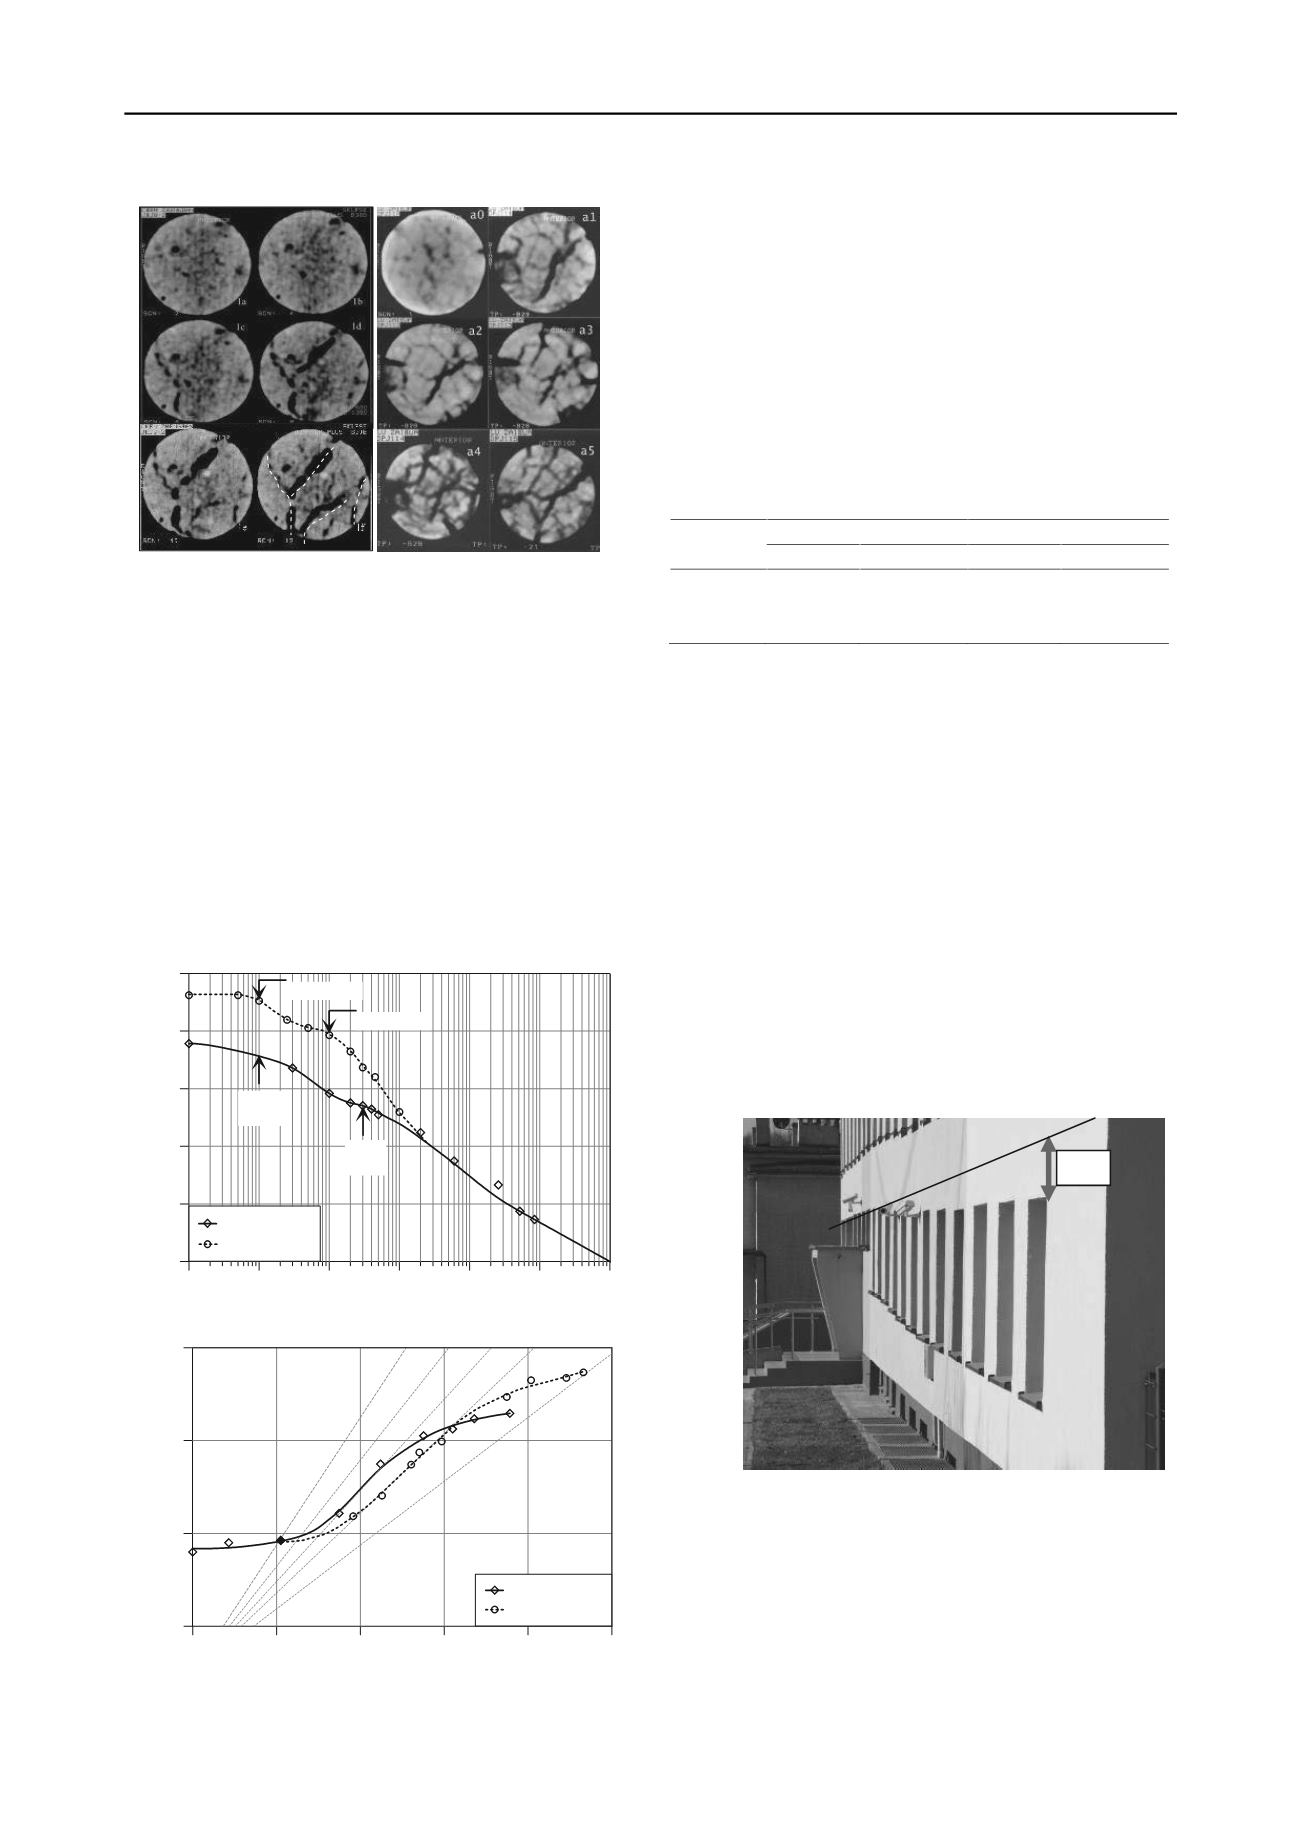
Figure 7. Internal structure evolution by CT scanning (section located at
1/3 of height) during: left - triaxial compression and right - several wet-
dry cycles (Chen 2013).
A comprehensive characterisation of the engineering
properties of the expansive glacio-lacustrine Regina clay
(Canada) is conducted by Azam et al. (2013). The clay contains
minerals like smectite, hydrous mica and chlorite, whereas the
clay size fraction (material finer than 0.002mm) is around 65%.
The soil water characteristic curve (SWCC) determined to
investigate the water retention capacity of the soil showed the
bimodal shape with two air entry values: an initial low value
corresponding to macroporous drainage (through fissures)
followed by a high value related to microporous flow (Figure 8,
top). The shrinkage curve was found to be S-shaped and
included a low structural shrinkage followed by a sharp decline
during normal shrinkage and then by a low decrease during
residual shrinkage (Figure 8, bottom).
Figure 8. Top: SWCC with gravimetric water content; bottom:
shrinkage curves (Azam et al. 2013).
The influence of swelling on the mechanical properties of
Clay Geosynthetic Barrier that contains bentonite
(predominantly montmorillonite) is studied by
Domitrović and
Zelić (2013).
Initial swelling behaviour is explored through
long-term swelling tests using an oedometer. The intensity of
swelling decreases as normal stress level increases, however,
the time for completion of the primary swelling is independent
on the stress level, approximately 31 days. The shear behaviour
of the bentonite is studied in direct shear box on samples under
three normal stresses and with different hydration time (7, 14
and 21 days). Table 1 shows the value of the peak and residual
shear strength parameters; the angle of friction increases while
the cohesion decreases with the hydration time.
Table 1. Shear strength parameters (
Domitrović and Zelić
2013)
.
Hydration
time
Peak parameters
Residual parameters
c (kPa)
(°)
c (kPa)
(°)
7 days
11.99
11.23
11.05
7.80
14 days
8.04
12.47
4.79
9.38
21 days
6.32
12.27
3.63
9.31
Residual strength of three clay soils (clay fraction between
70% and 80%) from North-Eastern Greece with high and very
high swelling potential is evaluated by performing ring shear
tests on remoulded samples at their optimum moisture content
by Markou (2013). While the residual failure envelope appears
curved, for normal stresses up to 200 kPa it can be considerd as
linear. In all cases, the residual friction angle does not exceed
14
o
.
The analysis of expansive properties of natural Neogen clays
(smectite, illite minerals) that forms the main foundation
stratum of Northern Poland is performed by Kumor (2013).
Expansive clays of Northern Poland can be classified as very
expansive with a contractibility range
(LL
–
SL)
of 82.1% >
50%, where LL is the liquid limit and SL is the contractility
limit. Swelling pressures that cause lifting of structures and
shrinkage that cause differential settlements are the main causes
of structural failures in Poland (Figure 9). The examination of
the volumetric changes in clays during laboratory shrinkage and
swelling phases allowed the refinement of the in-situ
shrink/swell predictions.
Figure 9. An example of a construction failure resulting from the
application of natural swell-shrink cycles in Poland (Kumor 2013).
4 CONSOLIDATION/COMPRESSIBILITY
It is known that three-dimensional effects may significantly
accelerate the rate of settlement of foundations on clay,
primarily because of the ability of excess pore water pressure to
dissipate horizontally as well as vertically. These effects are
further accelerated by the use of radial drainage. However, most
①
②
③
④
10
0
10
1
10
2
10
3
10
4
10
5
10
6
Soil Suction (kPa)
0
10
20
30
40
50
Gravimetric Water Content (%)
In situ soil
Compacted soil
Fissure
AEV
Matrix
AEV
Matrix AEV
Fissure AEV
S
= 70%
0
10
20
30
40
50
Gravimetric Water Content (%)
0.2
0.6
1.0
1.4
Void Ratio
In situ soil
Compacted soil
S
= 100%
S
= 60%
S
= 50%
S
= 80%
43 cm


