118
Proceedings of the 18
th
International Conference on Soil Mechanics and Geotechnical Engineering, Paris 2013
Proceedings of the 18
th
International Conference on Soil Mechanics and Geotechnical Engineering, Paris 2013
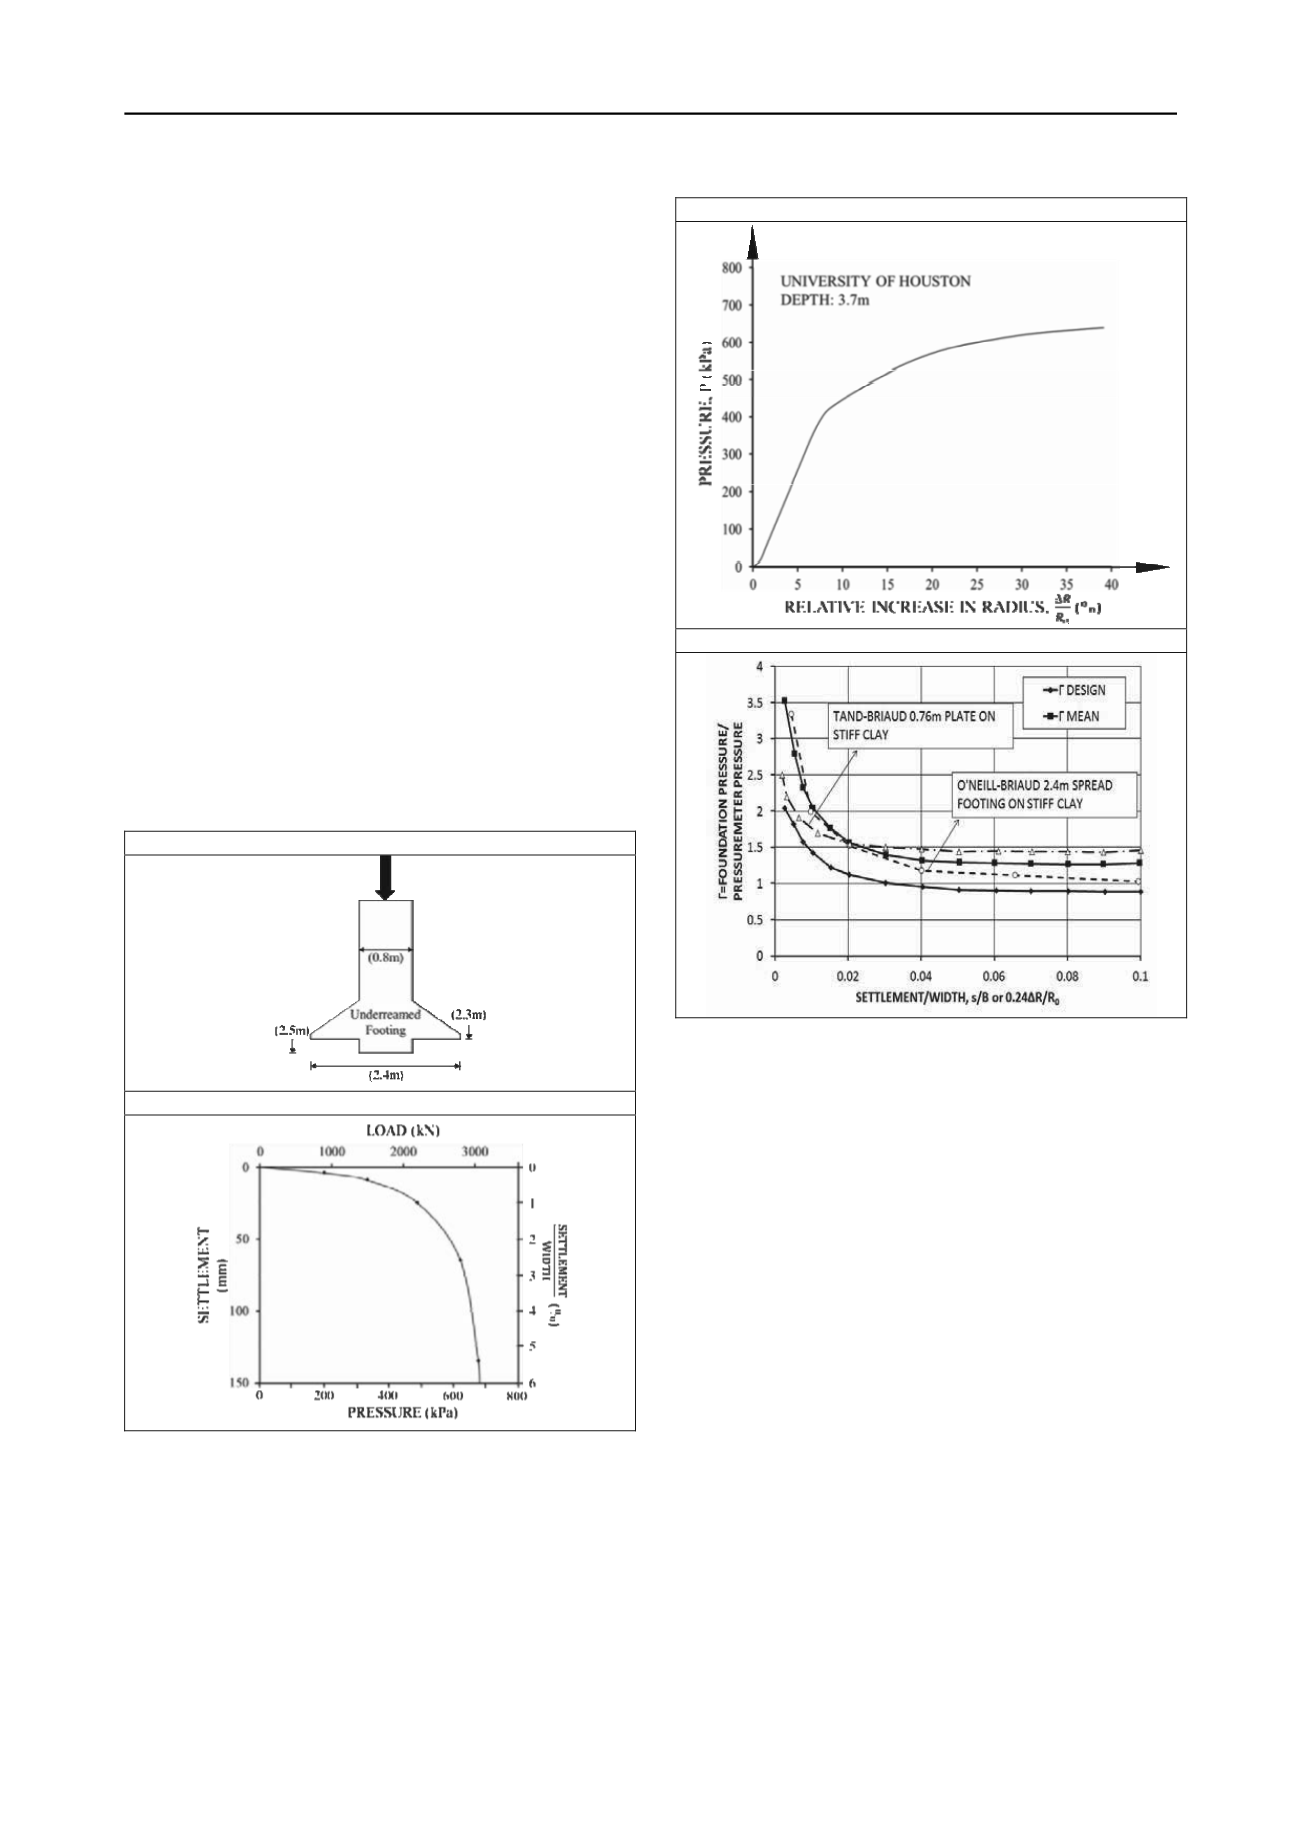
8.3 Load settlement curve method for footings on stiff clay
The load settlement curve method developed for sand was
extended to stiff clay by using some footing load tests and
parallel PMT tests. O’Neill and Sheikh (1985) load tested a 2.4
m diameter bored and under-reamed pile in Houston (Fig. 18a).
The pile was 2.4 m deep (relative embedment depth D/B = 1)
and the shaft friction was disabled by a casing. The soil was a
stiff clay with an undrained shear strength of about 100 kPa.
The load was increased in equal load steps and the resulting
load settlement curve is shown in Fig. 18b. At failure, the
average pressure under the footing was 680 kPa as measured by
pressure cells on the bottom of the under-ream. Briaud et al.
(1985) performed pressuremeter tests at the same site around
the same time. The PMT test was carried out at a depth of 3.6 m
or half a diameter below the bottom of the footing; this PMT
curve (Fig.19a) was used to generate the Γ function for that stiff
clay (Fig. 19b). As can be seen, the curve for that stiff clay is
very close to the recommended mean curve for sand. Load tests
on stiff clay using a 0.76m diameter plate at a depth of 1.52m
(Tand, 2013) were also analyzed together with parallel PMT
tests (Briaud, 1985) and gave the other Γ functions on Fig.19b.
These tests on stiff clay give an indication that the design Γ
function of Fig. 17b is equally applicable to sands and stiff
clays. Note that the load settlement curve method gives the
response of the footing as measured in load tests. These load
tests are carried out in a few hours; if the loading time is very
different (one week or more or one second or less), the time
effect must be considered separately (Section 7.4).
a. LOAD TEST SET UP
b. LOAD TEST RESULTS
Figure 18. Large scale footing load test in stiff clay in Houston
(O’Neill, Sheikh, 1985)
a. PMT CURVE
b. THE Γ FUNCTION
Figure 19. Pressuremeter test (Briaud et al, 1985) and Γ
function for stiff clay
9 DEEP FOUNDATIONS UNDER VERTICAL LOADS
The rules developed by the French administration (Fascicule 62,
1993) for calculating the vertical capacity of piles are based on
a very impressive database of load tests carried out by
Bustamante and Gianeselli and the Laboratoires des Ponts et
Chaussees from about 1975 to 1995. These rules were recently
updated (NF P94-262, 2012) and represent one of the most
complete and detailed axial capacity methodology in existence.
These rules should be followed closely as there is no viable
alternative for the PMT.
One area of deep foundations where the pressuremeter has
seen some expanded use is the foundation design of very tall
buildings such as the 452 m high Petronas Towers in Kuala
Lumpur, Malaysia (Baker, 2010), the 828 m high Burj Khalifa
in Dubai, UAE (Poulos 2009), the planned 1000 m high
Nakheel Tower in Dubai, UAE (Haberfield, Paul, 2010), and
the planned 1000m+ Kingdom Tower in Jeddah, Saudi Arabia
(Poeppel, 2013). It is also seeing increased use for very large
foundations such as the I10/I19 freeway interchange in Tucson,
USA (Samtani, Liu, 2005). The use of the PMT for very tall
buildings started with the work of Clyde Baker between 1965
and 1985 (Baker, 2005) for the Chicago high-rises where the
use of the pressuremeter in the glacial till allowed Clyde Baker
to increase the allowable pressure at the bottom of bored piles
from 1.4 MPa to 2.4 MPa. The 1.4 MPa value was based on
unconfined compression tests; the use of the pressuremeter
along with observations led to using the 2.4 MPa value as
confidence was gained.


