123
Honour Lectures /
Conférences honorifiques
Proceedings of the 18
th
International Conference on Soil Mechanics and Geotechnical Engineering, Paris 2013
5
6
7
8
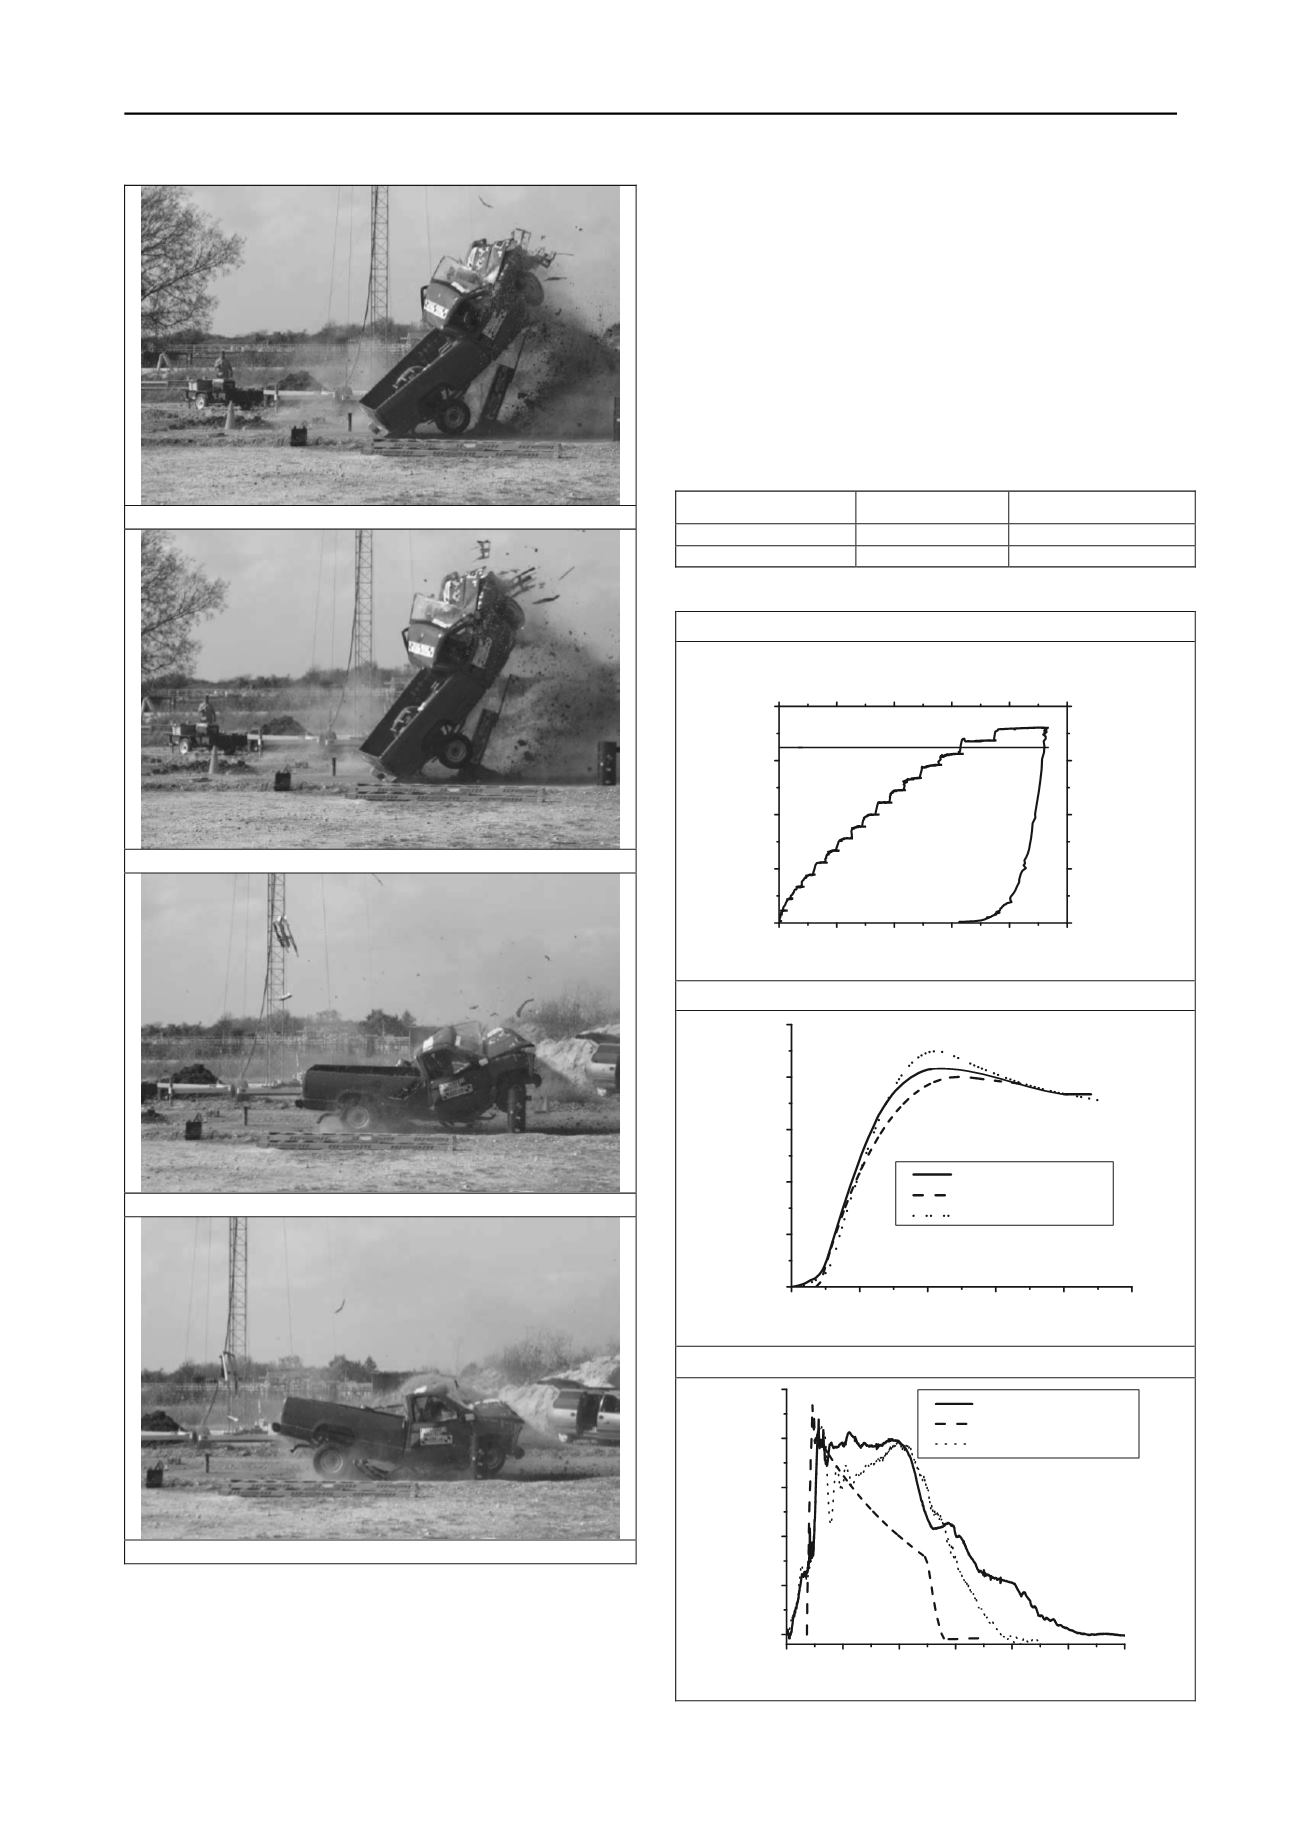
Figure 31. Pick-up truck impact test
Fig. 31 shows a photo sequence of an impact test where a 2300
kg pick up truck impacted a pile at 97.2 km/h. The pile was a
steel pipe with a 356mm diameter and a 12.7mm wall thickness.
It was embedded 2 m into a very stiff clay which gave the PMT
parameters shown in Table 7. PMT tests were performed with a
Pencel pressuremeter by first driving a slightly smaller diameter
rod in the very stiff clay and then driving the Pencel probe in
the slightly undersized hole. A comparison between the
measured and calculated behavior of the pile (movement, load,
and time) is presented in Fig. 32. The calculations were based
on the simple Excel program (TAMU-POST, Mirdamadi, 2013)
and a 4D FEM simulation using LS-DYNA (2006). The load
was obtained by measuring the deceleration of the truck by
placing an accelerometer on the bed of the truck and the
movement by using high speed cameras.
Table 7. PMT results by driven Pencel pressuremeter
DEPTH OF TEST
MODULUS
LIMIT PRESSURE
1 m
45 MPa
1400 kPa
1.8 m
25 MPa
1200 kPa
a. STATIC TEST: LOAD VS. MOVEMENT
0
14
28
42
56
70
0
40
80
120
160
0.00 0.04 0.08 0.12 0.16 0.20
0.0
3.0
6.0
9.0
12.0
DISPLACEMENT/WIDTH
(
/B)
PRESSURE (P/BD
v
)
(kPa)
LOAD (kN)
DISPLACEMENT (mm)
H
ou
=0. 75x1300x
0.35x0. 38=129. 7 kN
b. IMPACT TEST: MOVEMENT VS. TIME
0.00 0.05 0.10 0.15 0.20 0.25
0
200
400
600
800
1000
x DISPLACEMENT (mm)
TIME (sec)
Experiment
TAMU-POST (Excel)
LS DYNA
c. IMPACT TEST; FORCE VS.TIME
0.00 0.05 0.10 0.15 0.20 0.25 0.30
0
100
200
300
400
500
Experiment
TAMU-POST (Excel)
LS-DYNA
LOAD (kN)
TIME (sec)


