130
Proceedings of the 18
th
International Conference on Soil Mechanics and Geotechnical Engineering, Paris 2013
4
conditions of this column test would result in not only an
incorrect but also an unconservative (high) estimate of the
breakthrough time.
0
0.1
0.2
0.3
0.4
0.5
0.6
0.7
0.8
0.9
1
0 10 20 30 40 50 60
(b)
Relative Concentration,
C
(
L
,
t
)/
C
o
Elapsed Time,
t
(yr)
k
h
= 5 x 10
-10
m/s
L
= 0.91 m
n
= 0.5
i
h
= 1.33
14.8 yr
21.8 yr
Pure
Advection
Advection
+
Mechanical
Dispersion
Advection
+
Diffusion
10
-11
10
-10
10
-9
10
-8
0 10 20 30 40 50 60 70 80
(c)
Hydraulic Conductivity,
k
h
(m/s)
Transit Time @
C
(
L
,t)/
C
o
= 0.5,
t
0.5
(yr)
Pure
Diffusion
(
i
h
= 0)
Pure
Advection
Advection
+
Diffusion
14.8 yr
21.8 yr
48.5 yr
L
= 0.91 m
n
= 0.5
i
h
= 1.33
k
h
= 2.2 x
10
-10
m/s
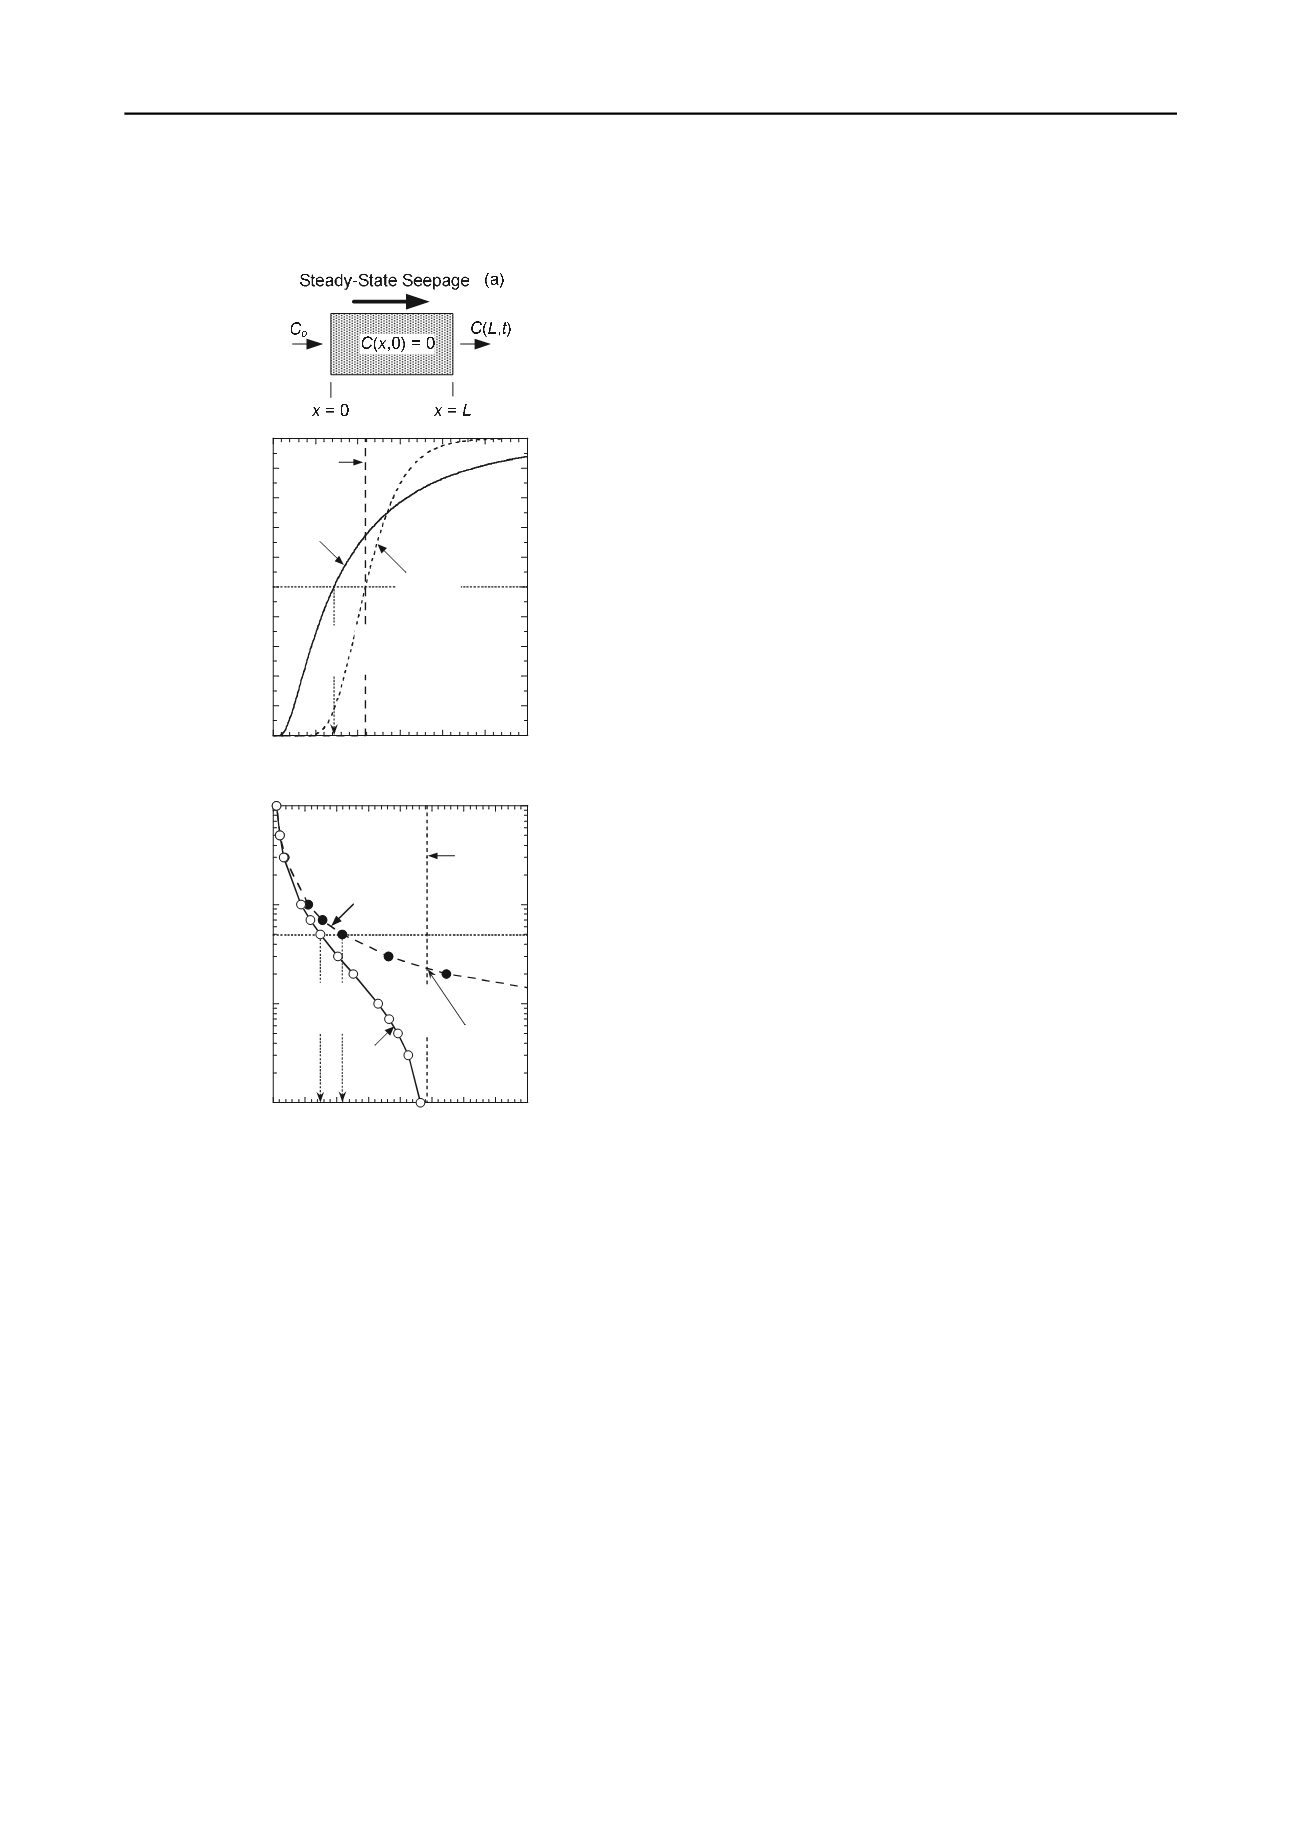
Figure 1. Effect of diffusion on solute transport through a column
of soil of length
L
, porosity
n
, and hydraulic conductivity
k
h
, under
a hydraulic gradient of
i
h
; (a) column containing porous medium;
(b) breakthrough curves illustrating effect of diffusion at low
k
h
;
(c) transit (breakthrough) times,
t
0.5
, as a function of
k
h
(modified
after Shackelford 1988).
As previously implied, the decrease in the breakthrough
time due to diffusion evident in the BTCs shown in Fig. 1b
is a function of the magnitude of the seepage velocity. This
dependence on
v
s
is illustrated in Fig. 1c, where the
breakthrough times at
C
(
L
,
t
)/
C
o
of 0.5, or
t
0.5
, are shown
for the cases of pure advection and advection plus
diffusion as a function of the
k
h
of the porous medium in
the column, all other conditions being the same (i.e.,
L
=
0.91 m,
n
= 0.5,
i
h
= 1.33). The limiting case of pure
diffusion (
i
h
= 0) also is shown in Fig. 1c for comparison.
The horizontal distance between the pure advection and
advection plus diffusion curves represents the offset
distance at
C
(
L
,
t
)/
C
o
of 0.5, or
t
0.5
, in Fig. 1b for a given
k
h
. The independence of pure diffusion on
k
h
is represented
by a vertical line corresponding to
t
0.5
of 48.5 yr. Three
observations are apparent from the curves shown in Fig. 1c
(Shackelford 1988): (1) diffusion has an effect (i.e.,
t
0.5
>
0) even at a
k
h
of 10
-9
m/s, which typically is the maximum
regulated
k
h
value for many waste containment
applications; (2) the sole use of Darcy's law (i.e., pure
advection) to predict breakthrough times is extremely
unconservative at
k
h
values less than about 2.2 x 10
-10
m/s;
and (3) diffusion starts to become the dominant transport
process (i.e., as the curve for advection plus diffusion starts
to approach asymptotically that for pure diffusion) at a
k
h
value of about 2 to 3 x 10
-10
m/s. Of course, the solute
mass flux also would be significantly reduced with
decreasing
k
h
, but still may be environmentally significant
(e.g., Johnson et al. 1989). Regardless, this simplified
analysis illustrates the importance of diffusion in low
permeability porous media.
In terms of concentration profiles, consider the scenario
depicted in Fig. 2a corresponding to a ponded source of
liquid containing a nonreactive chemical species at a
constant concentration,
C
o
, underlain by an initially
uncontaminated soil with an
n
of 0.5. The resulting
concentration profiles beneath the source at an elapsed
time of 5 yr assuming a
D
*
of 6 x 10
-10
m
2
/s are shown in
Figs. 2b, 2c, and 2d for advective dominated (
k
h
= 10
-8
m/s), diffusive significant (
k
h
= 10
-9
m/s), and diffusive
dominated (
k
h
= 10
-10
m/s) cases, respectively. For the
advective dominated case (Fig. 2b), the pure advective
(seepage) front extends the furthest distance (> 4 m), there
is little difference between mechanical dispersion and
diffusion, and all concentration profiles intersect at
C
(
x
,
t
)/
C
o
of 0.5. For the diffusive significant case (Fig. 2c),
the pure advective front is much shallower (< 1 m),
dispersion due to diffusion is much greater than that due to
mechanical dispersion, and the concentration profile for
advection plus diffusion intersects that for pure advection
at
C
(
x
,
t
)/
C
o
~ 0.68. Finally, for the diffusive dominant case
(Fig. 2d), the depth of penetration of the pure advective
front is virtually imperceptible as is the concentration
profile for advection plus mechanical dispersion, and
almost the entire concentration profile for advection plus
diffusion extends beyond that for the pure advection case.
Thus, although the extent of contaminant migration is
greatest when the
k
h
value of the subsurface soil is the
greatest, the extent of migration predicted on the sole basis
of advection (i.e., Darcy's law) becomes increasingly
unconservative as the
k
h
of the subsurface soil decreases,
such that diffusion becomes more prominent. As will be
shown subsequently,
associating the shapes of
concentration profiles with the dominant transport
processes played an important role in the recognition of
diffusion as a potentially important transport process.
4 DIFFUSION IN CONTAINMENT APPLICATIONS
4.1
Containment Scenarios
In terms of waste containment scenarios, there are three
general scenarios of interest, as illustrated in Fig. 3. The
first case illustrated in Fig. 3a is the limiting case of pure
diffusion. For waste containment scenarios involving
horizontal barriers (liners), the likelihood that the pure
diffusion case will be realized in practice is relatively
remote, as there almost always will be a hydraulic gradient
driving advective transport.


